Customize a data card in Power Map
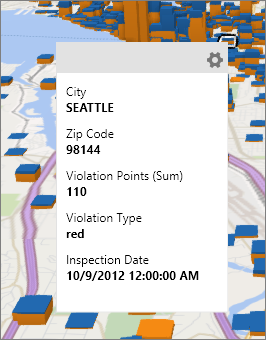
When you hover over or click any data point on your map (except heat map visualizations), you'll see a data card that shows details about that data point.

By default, a data card shows information based on default field list selections, but you can customize the data card to show the details you want. You can add or remove data fields, change the way those fields are aggregated or organized, include a title (such as a location name), or rename the field headers. You can also pick predefined data fields from a set of layout templates.
Here's how to customize what's shown in a data card:
-
Point to a data point to show its data card.
-
In the top-right corner of the data card, click the Settings button
 .
.Tip: You can also click the Settings button in the Layer pane and click Create custom display names and data aggregations under Customize Data Card.
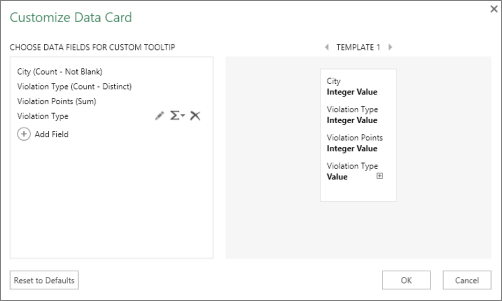
The Customize Data Card box appears.

-
To add fields, click the Add Field icon
 , and pick the field you want. You can scroll down to see all available fields as needed.
Repeat this step for each field you want to show in the data card.
-
To make changes to a field, hover over its name to show these buttons:
 .
.To change a field name, click
 .
. To change the way a field aggregates, click
 .
.Data is aggregated as sum by default. You can choose different ways to aggregate, or pick No Aggregation.
To remove a field from the data card, click
 .
. -
To change the order of the fields in the data card, drag and drop data fields to the location you want.
-
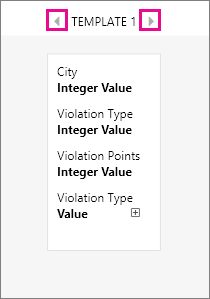
To add a title or change the layout, click the template arrows to select the template that meets your needs.

-
To start over, you can click Reset Defaults.
Custom settings you applied will be removed.
Tips:
-
If you want to add your own text to items in the map, you can insert it as an annotation. Power Map automatically adjusts the orientation of annotations. Unlike data cards, annotations stay visible with the associated data point.
-
You can also add a text box to provide additional details. A text box isn't associated with a data point and stays visible on the map in the location where you placed it.
No comments:
Post a Comment