Filter data in a 3D Maps tour
To see a subset of data in your 3D Maps tour, you might have tried filtering the data source in the workbook, but found out it has no effect on what's shown in the tour.

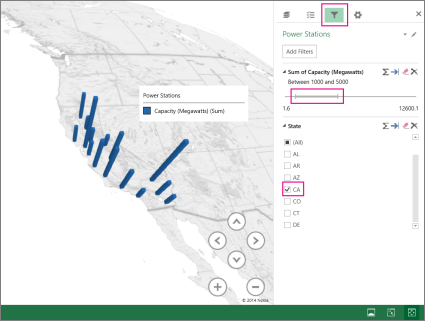
To filter data in the tour, you can add and change filters in the Tour Editor pane. The picture above has a filter applied to show only California (CA) counties that have power plants with total capacity between 1000 and 5000 megawatts.
-
In the Tour Editor pane, click Filter
 .
. -
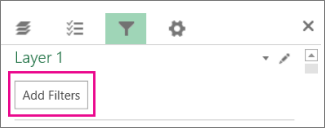
Click Add Filters.

-
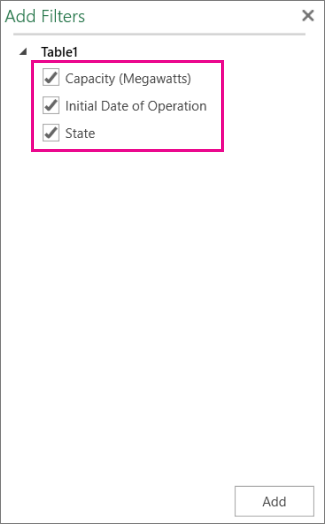
Choose the fields you want to filter, then click Add.

-
Set your filters by using a Range filter (a slider bar), a List filter (check boxes), or an Advanced filter (criteria statements).

Do one of the following to set filters on the fields:
-
Set a Range filter by using the slider bar.
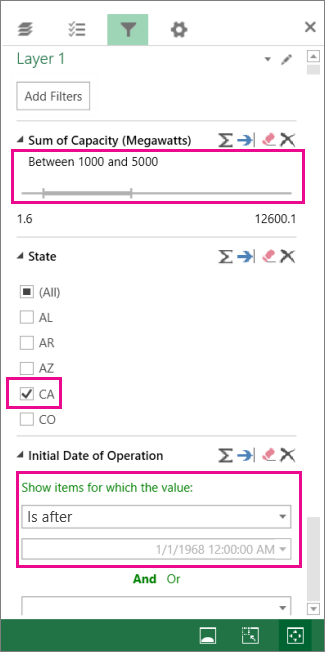
In the picture above, a Range filter sets the Sum of Capacity (Megawatts) range between 1000 and 5000.
-
Set a List filter by choosing one or more check boxes.
In the picture above, a List filter is set to show only data from power plants in CA.
-
Set an Advanced filter, where you can build multiple criteria statements.
In the picture above, an Advanced filter limits the Initial Date of Operation to dates no earlier than 1/1/1968.
Tips:
-
Use the button shown below to switch between a Range or List filter and an Advanced filter.
-

Microsoft Office Tutorials: Filter Data In A 3D Maps Tour >>>>> Download Now
ReplyDelete>>>>> Download Full
Microsoft Office Tutorials: Filter Data In A 3D Maps Tour >>>>> Download LINK
>>>>> Download Now
Microsoft Office Tutorials: Filter Data In A 3D Maps Tour >>>>> Download Full
>>>>> Download LINK Bv