Overview of Project views
Views display, in a particular format, a subset of the information that you enter in Microsoft Office Project. That subset of information is stored in Project and is displayed in any view that calls for it. For example, the task duration that you enter in the chart portion of the Gantt Chart view also appears in the Task Sheet view.
In this article
Understand the types, formats, and components of Project views
Project provides different types of views that present project information by using different formats and components, such as tables, filters, groups, and details. It is important to understand the difference between these properties.
Types
Project uses three types of views: task views, resource views, and assignment views.
Formats
Project views use several different display formats. View formats include: Gantt Chart, Network Diagram, graph, sheet, usage, and form.
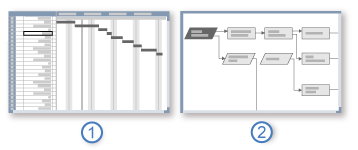
Gantt Chart views, Network Diagram views, and graph views present information graphically.

 Gantt Chart views consist of a table and a bar chart.
 Network Diagram views consist entirely of a chart.
Gantt Chart views display a list of your tasks on the leftmost side of the view, with a graphical representation of those tasks in bars that span a timescale on the rightmost side of the view. This format can be helpful when initially planning your schedule, and for reviewing your schedule as the project progresses.
Network Diagram views display your tasks in a flowchart format. This format can be helpful when fine-tuning your schedule.
Graph views provide an illustration of your project's schedule and progress.
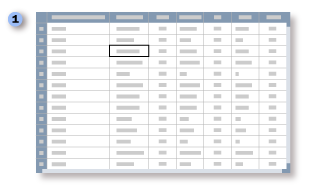
Sheet views present information in rows and columns, similar to a spreadsheet. Rows contain information about tasks or resources. Columns in Project are typically referred to as fields and you use them to enter specific information about tasks or resources.

 A sheet view resembles a spreadsheet or table of information.
Usage views list task or resource data in rows and columns on the leftmost side of the view, and show timephased data across rows and columns on the rightmost side of the view.
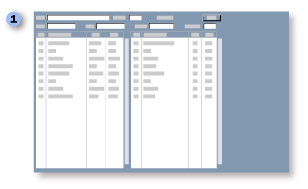
Form views present detailed information in a structured format about one task or resource at a time.

 A form view makes it easy to enter information about specific tasks and resources.
Components
Each view is made up individual components, such as tables, filters, groups, and details. To focus on a specific task, resource, or assignment in a view, you can display a different table and change a filter or group. In some views, you can also change the type of data that is displayed.
-
A table is a set of fields displayed in the sheet portion of a view as columns and rows. The default table displayed differs by view.
-
A filter is a set of criteria for displaying specific tasks, resources, or assignments. The default filter applied to a view is either the All Tasks filter (for task views) or the All Resources filter (for resource views).
-
A group displays a specific category of project information. By grouping, you can categorize and view rolled-up tasks, resource, or assignment information in a variety of ways. No group is applied by default.
-
Details consist of closely related fields that are displayed either in columns, as in a form view, or in tables that show information over time, as in a usage view.
Changing tables, filters, groups, or view details does not add or delete information stored in Project, it merely presents a portion of the information in different ways. If you often choose to look at information a particular way, you can customize and save a view with different default settings for tables, filters, groups, and details. You can choose to include these custom views on the View menu.
What view should I use?
When using the views in Project, decide what information you want to see (task, resource, or assignment data), and then decide what format you want to use. This helps you identify which view will best suit your needs. For example, if you want to enter resource data for your project in a spreadsheet, choose the Resource Sheet view or the Resource Usage view. To view task information using a bar chart along a timeline, chose the Gantt Chart view. To review resource usage data on a graph, choose the Resource Graph view.
Tip: To see a list of views in a pane along the side of the Project window, on the View menu, click View Bar. The view bar displays icons for the views listed in the View menu.
If a single view isn't providing you with enough detail, you might find a combination view helpful. Combination views display two views at the same time. When you select a task or resource in the top pane of a combination view, the view in the bottom pane shows detailed information about the selected task or resource. For example, when you display any task view in the top pane and the Resource Usage view in the bottom pane, the view in the bottom pane shows the resources assigned to the tasks selected in the top pane, along with information about those resources. The resource information shown pertains to all assigned tasks for each resource, not just to the tasks selected in the top pane.
Tip: To display multiple views as a combination view, on the Window menu, click Split. To revert back to displaying only one view, on the Window menu, click Remove Split.
Use the following sections to learn more about the views used for task, resource, and assignment data.
I want to view and enter task data
Task data is available for viewing in several formats, including Gantt Chart, Network Diagram, graph, sheet, usage, and form formats.
The following table describes each view that displays task data in Gantt Chart format.
| View | Description |
| Bar Rollup | View summary tasks with labels for all subtasks. Use the Bar Rollup view with the Rollup_Formatting macro to see all tasks concisely labeled on summary Gantt bars. |
| Detail Gantt | View tasks and associated information in a sheet, and see slack and slippage for tasks over time in a bar graph on a timescale. Use the Detail Gantt view to check how far a task can slip without affecting other tasks. |
| Gantt Chart | View tasks and associated information in a sheet, and see tasks and durations over time in a bar graph on a timescale. Use the Gantt Chart view to enter and schedule a list of tasks. This is the view that appears by default when you first start Project. |
| Leveling Gantt | View tasks, task delays, and slack in a sheet, and the before-and-after effects of the Project leveling feature. Use the Leveling Gantt view to check the amount of task delay caused by leveling. |
| Milestone Date Rollup | View summary tasks with labels for all subtasks. Use the Milestone Date Rollup view with the Rollup_Formatting macro to see all tasks concisely labeled with milestone marks and dates on summary Gantt bars. |
| Milestone Rollup | View summary tasks with labels for all subtasks. Use the Milestone Rollup view with the Rollup_Formatting macro to see all tasks concisely labeled with milestone marks on the summary Gantt bars. |
| Multiple Baselines Gantt | View different colored Gantt bars for the first three baselines (Baseline, Baseline1, and Baseline2) on summary tasks and subtasks in the chart portion of the view. Use the Multiple Baselines Gantt view to review and compare the first three baselines that you saved for your project. |
| PA_Expected Gantt | View your schedule's expected scenario, based on durations calculated from a PERT analysis. |
| PA_Optimistic Gantt | View your schedule's best-case scenario, based on durations calculated from a PERT analysis. |
| PA_Pessimistic Gantt | View your schedule's worst-case scenario, based on durations calculated from a PERT analysis. |
| Tracking Gantt | View tasks and task information in a sheet, and a chart showing a baseline and scheduled Gantt bars for each task. Use the Tracking Gantt view to compare the baseline schedule with the actual schedule. |
In addition to Gantt Chart views, Project offers several other views for entering and evaluating task data. The following table describes these views.
| Format | View | Description |
| Network Diagram | Descriptive Network Diagram | View all tasks and task dependencies. Use the Descriptive Network Diagram view to create and fine-tune your schedule in a flowchart format. This view is similar to the regular Network Diagram view, but the nodes are larger and provide more detail. |
| Network Diagram | Network Diagram | Enter, edit, and review all tasks and task dependencies. Use the Network Diagram view to create and fine-tune your schedule in a flowchart format. |
| Network Diagram | Relationship Diagram | View the predecessors and successors of a single selected task. In a large project or any project with more complex task linking, use this task view to focus on the task dependencies of a specific task. |
| Graph | Calendar | View tasks and durations for a specific week or range of weeks in a monthly calendar format. |
| Sheet | PA_PERT Entry Sheet | Enter your schedule's best-case, expected-case, and worst-case scenarios for a task's duration in preparation of calculating the most probable duration by using a PERT analysis, which helps you consider and reconcile disparities between different task estimates. |
| Sheet | Task Sheet | Enter, edit, and review task information in a spreadsheet format. |
| Form | Task Details Form | Enter, edit, and review detailed tracking and scheduling information about a selected task, one task at a time. The grid area can show information about assigned resources, predecessors, and successors. |
| Form | Task Form | Enter, edit, and review information about a selected task, one task at a time. The grid area can show information about the task's assigned resources, predecessors, and successors. |
| Form | Task Name Form | Enter, edit, and review the selected task's assigned resources, predecessors, and successors. The Task Name Form view is a simplified version of the Task Form view. |
I want to view and enter resource data
Project provides several views for resource data, in graph, sheet, and form formats. The following table describes these views.
| Format | View | Description |
| Graph | Resource Graph | View resource allocation, cost, or work over time for a single resource or group of resources at a time. Information is displayed in a column graph format. When used in combination with other views, the Resource Graph view can be very useful for finding resource overallocations. |
| Sheet | Resource Sheet | Enter, edit, and review resource information in a spreadsheet format. |
| Form | Resource Form | Enter, edit, and review all resource, task, and schedule information about a selected resource, one resource at a time. The grid area can show information about the resource's schedule, cost, or work on assigned tasks. It is most useful when used as part of a combination view. |
| Form | Resource Name Form | Enter, edit, and review the selected resource's schedule information about a selected resource, one resource at a time. The grid area can show information about the resource's schedule, cost, or work on assigned tasks. The Resource Name Form view is a simplified version of the Resource Form view. |
I want to view and enter assignment data
Assignment data is entered in views that use the usage format. The following table describes these views.
| View | Description |
| Task Usage | Review, enter, and edit assignments by task. In the sheet portion of the Task Usage view, each task is listed with the assigned resources indented beneath it. In the timesheet portion of the view, information such as work or costs for the task and the assignment is listed according to the timescale, for example, by day or by week. |
| Resource Usage | Review, enter, and edit assignments by resource. In the sheet portion of the Resource Usage view, each resource is listed with all associated task assignments indented beneath it. In the timesheet portion of the view, information such as work or costs for the resource and the assignment is listed according to the timescale, for example, by week or month. |
How is information processed in a view?
Views display information that Project calculates and enters for you in calculated fields. For example, Project automatically displays the start date in the Start field for each task. Furthermore, Project updates the information it calculates as you change related project information. You can edit calculated information in some cases.
With Office Project 2007, you can track the impact of changes to your project data by using change highlighting. When change highlighting is turned on, after a change is made to your project data, the cells containing data that are impacted by that change are shaded a different color. If the changes aren't desirable for your project, you can easily undo them and restore the previous data.
You can also shade the background of specific cells manually, or configure Office Project 2007 to automatically shade the backgrounds of cells that meet certain criteria.
What can be formatted in a view?
Before you distribute information about your project after having selected a view, you may want to format that view to better meet your needs. To make your project easier to read, you can highlight milestones, change the colors of task bars to match corporate standards, or change field titles to match your organization's terminology. It's easy to tailor views, and you can even save the modified views for later use.
| View | Formatting tips |
| Calendar |
|
| Gantt Chart |
|
| Task Usage or Resource Usage |
|
| Any sheet view |
|
Office Project 2007 includes new formatting options for the Calendar view. You can now display tasks across a one-week period, or across a custom date range, in addition to the one-month view. The Calendar view also includes a month pane, to display the three months surrounding the displayed date range.
No comments:
Post a Comment