In Visio Professional, you can color shapes depending on their data values. This is also known as the color by valuedata graphic. The coloring can be applied after you import data to shapes in your drawing.
For example, in the illustration below, all of the computer shapes that have the value "Off" are colored red. The computers that are "On" have the color of green.
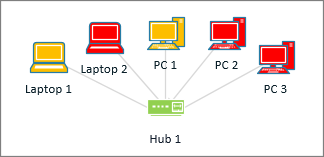
Note: Although Visio refers to "color by value" as a data "graphic," this option doesn't show additional "graphics" or symbols next to the shapes. Instead, it simply fills the shape with a color according to its data.
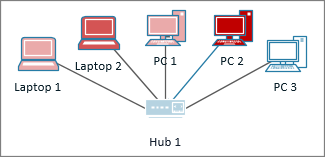
You can also apply different shades of color depending on a range of values. In the example below, the computers are colored by value. They are colored depending on how much their CPU is processing. Computers with high processing are dark red. Those with lower processing are colored with a lighter red, or even white.
Setting up Color by Value
-
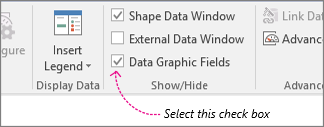
Make sure the Data Graphic Fields pane is open on the right. If it isn't open, on the Data tab, click to select the Data Graphic Fields check box.
-
Do one of the following:
-
If you want to change all shapes on the page, click an empty space on the diagram to deselect any shapes that may be selected.
-
If you want to change only select shapes on the page, click one or more shapes to select them.
-
-
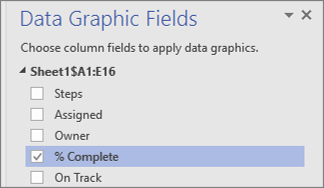
In the Data Graphic Fields pane, identify which field of data you want to apply coloring to.
-
In the same pane, make sure the field you want to change has a check mark, and make sure to select it so that it is highlighted in blue:
-
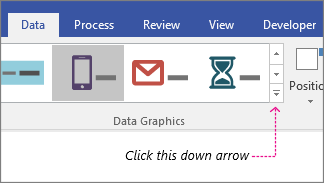
On the Data tab, click the down arrow at the bottom of the Data Graphic gallery.
-
Under Color by Value, select one of the following:
-
This option
 is for fields that have text values like "On," "Off," "On Track," "Off Track," and so on. In the above process, if you chose a field with text, choose this option.
 -
This option
 is for fields that have numeric values like percentages or amounts. In the above process, if you chose a field with numbers, choose this option.
-
Configuring the coloring
After applying a color, you may need to configure the colors to represent your data properly.
-
Do steps 1-4 above.
-
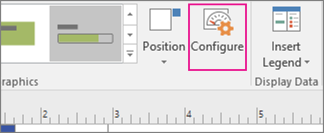
On the Data tab, click Configure.
-
Do one of the following:
-
If you chose this option:
, then choose a Fill Color for each of the possible values in your imported data. If you also want the shape text to get changed, select a Text Color.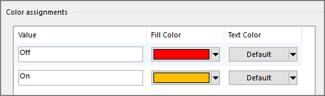
-
If you chose this option:
, you'll see that each fill color has a range. The bottom of the range is specified by Value 1 and the top is Value 2. Choose a Fill color for each of the ranges. If you also want the shape text to get changed, select a Text Color.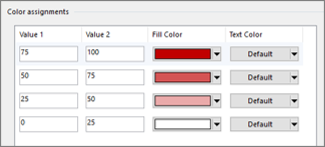
-
-
If you want to correct any of the values, you can do so in the Value columns.
-
If you want to add any additional coloring assignments, click Insert on the right, type new values, and choose colors for those value.
-
If you want to remove any coloring assignments, click Delete on the right.
Color shapes by value
With the Color by Value option of the Data Graphics feature, you can apply color to indicate unique values or ranges of values. For more information about the Data Graphics feature, see Enhance your data with data graphics.
-
On the Data menu, click Display Data on Shapes.
-
In the Data Graphics task pane, right-click the data graphic that you want to color code, and then click Edit Data Graphic on the shortcut menu.
-
In the Edit Data Graphic dialog box, click New Item, and then click Color by Value.
-
In the New Color by Value dialog box, under Display, select an item from the Data field list.
-
Under Coloring method, do one of the following:
-
Select Each color represents a unique value to apply the same color to all shapes that have the same value.
The Color assignments list shows all the available values and assigns a fill color and text color to each value. To select a different fill or text color, click the Fill Color or Text Color arrow.
-
Select Each color represents a range of values to use a range of colors, from bright to muted, to indicate a range of values.
The Color assignments list shows a list of possible value ranges and assigns a fill color and text color to each range. Type different values into the Value 1 and Value 2 boxes to create custom ranges. To select different fill and text colors for each value, click the Fill Color or Text Color arrow. However, to preserve the bright-to-muted effect of the color sets, we recommend that you choose a different color for only the first item in the Color assignments list.
-
-
To apply the settings to shapes in your drawing, click OK first in the New Color by Value dialog box and then in the Edit Data Graphic dialog box.
No comments:
Post a Comment