If you need to print a chart in Excel 2013 or Excel 2016, you can use the Print option from the File tab. You can use the Settings menu to specify precisely the item you want to print from your workbook.
-
Click the chart within your workbook.
-
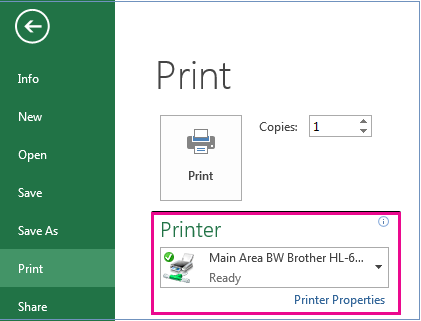
Click File > Print.
Tip: You can also use the keyboard shortcut, Ctrl + P, to open the Print option.
-
Click the Printer drop-down menu, and select the printer you want to use.
-
Click Print.
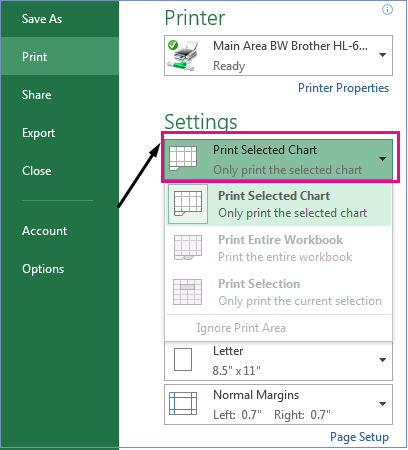
Tip: You can use the Settings option to identify the specific item you want to print. Click Settings drop-down menu, and click Print Selected Chart to print just the chart, or click Print Entire Workbook to print the entire workbook.
Related Topics
Print a chart with worksheet data
-
Click the worksheet that contains the chart that you want to print.
-
On the View tab, in the Workbook Views group, click Page Layout or Page Break Preview.
-
To move the chart, drag it to a preferred location on the page that you want to print.
-
To resize the chart, do one of the following:
-
Click the chart, and then drag the sizing handles to the size that you want.
-
On the Format tab, in the Size group, enter the size in the Shape Height and Shape Width box.

-
-
If a worksheet contains more than one chart, you may be able to print the charts on one page by reducing the size of the charts.
-
Click the worksheet.
-
Click the Microsoft Office Button
 , and then click Print.
By default, Active sheet(s) is selected under Print what.
You can click Preview to see how the chart will look on the printed page.
By default, cell gridlines are not printed on a worksheet. To print the worksheet with cell gridlines displayed, see Print gridlines in a worksheet.
Print a chart without worksheet data
You can print one chart without worksheet data per page.
-
Click the chart that you want to print.
If the chart is on a separate chart sheet, click the chart sheet tab.
-
Click the Microsoft Office Button
, and then click Print.By default, Selected Chart is selected under Print what.
You can click Preview to see how the chart will look on the printed page.
Note: You cannot scale a chart before you print it. Instead, you can move and size the chart area of the chart to adjust is as needed. For more information, see Move or resize a chart.
Set page options for a chart
-
On the Page Layout tab, in the Page Setup group, click the Dialog Box Launcher
 .
.
-
Do one or more of the following:
-
On the Page tab, specify the orientation, paper size, print quality, and the page number of the first page.
Note: You cannot adjust the scaling of a chart.
-
To quickly specify the orientation of the printed pages, on the Page Layout tab, in the Page Setup group, click Orientation, and then click Portrait or Landscape.
Set page margins for a chart
-
On the Page Layout tab, in the Page Setup group, click Margins.
-
Do one of the following:
-
To use predefined margins, click the margin option that you want.
-
To specify custom page margins, click Custom Margins, and then in the Top, Bottom, Left, and Right boxes, enter the margin sizes that you want.
-
To set header or footer margins, click Custom Margins, and then enter a new margin size in the in the Header or Footer box. Setting the header or footer margins changes the distance from the top edge of the paper to the header or from the bottom edge of the paper to the footer.
Note: The header and footer settings should be smaller than your top and bottom margin settings, and larger than or equal to the minimum printer margins.
-
To see how the margins will affect the printed worksheet, click Print Preview. To adjust the margins in print preview, click Show Margins, and then drag the black margin handles on either side and at the top of the page.
-
Note: You cannot center the page horizontally or vertically for charts.
Change the print quality of a chart
-
Click the chart that you want to print.
-
On the Page Layout tab, in the Page Setup group, click the Dialog Box Launcher
. -
On the Chart tab, under Printed quality, select the Draft quality check box, the Print in black and white check box, or both.
To see the result of the print quality settings that you select, click Print Preview.
-
Click Print.
Microsoft Office Tutorials: Print A Chart >>>>> Download Now
ReplyDelete>>>>> Download Full
Microsoft Office Tutorials: Print A Chart >>>>> Download LINK
>>>>> Download Now
Microsoft Office Tutorials: Print A Chart >>>>> Download Full
>>>>> Download LINK AK