Track tasks using Project 2007
Microsoft Office Project 2007 Step by Step
By Carl Chatfield and Timothy Johnson
Carl Cha tfield is a certified Project Management Professional (PMP) with extensive knowledge of Microsoft Office Project as well as specific usability issues.
Timothy Johnson has previously worked as an Office Project support professional for several years. Tim possesses in-depth technical knowledge about the software.
Carl and Timothy are the authors of Microsoft Project 2000 Step by Step, Microsoft Project Version 2002 Step by Step and Microsoft Office Project 2003 Step by Step, all from Microsoft Press.
To learn more about other books on the 2007 Microsoft Office system, visit Microsoft Press.
In this article
When work on a project begins, so does the next phase of project management: tracking progress. Tracking means recording project details such as who did what work, when the work was done, and at what cost. These details are often called actuals. Tracking actuals is essential to properly managing, as opposed to just planning, a project.
Save a project baseline
After developing a project plan, one of a project manager's most important activities is to record actuals and evaluate project performance. To judge project performance properly, you will need to compare it with your original plan. This original plan is called the baseline plan or just the baseline. A baseline is a collection of important values in a project plan such as the planned start dates, finish dates, and costs of the tasks, resources, and assignments. When you save a baseline, Microsoft Office Project 2007 takes a "snapshot" of the existing values and saves it in your project plan for future comparison.
The specific values saved in a baseline include the task, resource, and assignment fields, as well as the timephased fields, which are shown on the following list.
| Task Fields | Resource Fields | Assignment Fields |
| Start | Work and timephased work | Start |
| Finish | Cost and timephased cost | Finish |
| Duration | Work and timephased work | |
| Work and timephased work | Cost and timephased cost | |
| Cost and timephased cost |
Tip: Timephased fields show task, resource, and assignment values distributed over time. For example, you can look at a task with five days of work planned at the weekly, daily, or hourly level and see the specific baseline work values per time increment.
You should save the baseline when:
-
You have developed the project plan as fully as possible. (However, this does not mean that you cannot add tasks, resources, or assignments to the project after work has started, for this is often unavoidable.)
-
You have not yet started entering actual values, such as a task's percentage of completion.
Track a project as scheduled
The simplest approach to tracking progress is to report that the actual work is proceeding exactly as planned. For example, if the first month of a five-month project has elapsed and all of its tasks have started and finished as scheduled, you can quickly record this in the Update Project dialog box.
On your project, suppose some time has passed since you saved the baseline. Work has started, and so far, so good. The following exercise shows how you can record project actuals by updating work to a specific date.
-
On the View menu, click Gantt Chart. The Gantt Chart view appears.
-
On the Tools menu, point to Tracking, and click Update Project. The Update Project dialog box appears.
-
Make sure the Update work as complete through option is selected. In the adjacent date box, type or select a date such as 1/16/08 through which the task will be tracked.
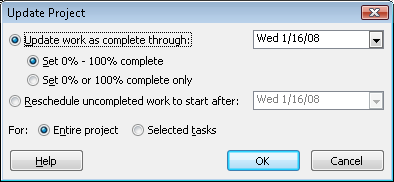
Tip: You can also click the down arrow in the Update Work As Complete Through date box and, in the calendar that appears, select the desired date. There are several date fields in the Project 2007 interface that use this pop-up calendar.
-
Click OK.
Project 2007 records the completion percentage for the tasks that were scheduled to start before the date you entered. It then displays that progress by drawing progress bars in the Gantt bars for those tasks.
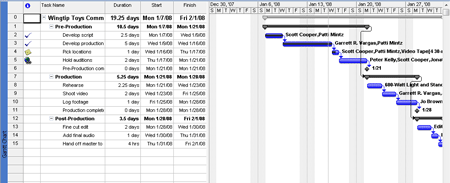
In the Gantt Chart view, the progress bar shows how much of each task has been completed. A check mark appears in the Indicators column next to tasks that have been completed, and the progress bars extend through the full length of those tasks' Gantt bars.
Enter a task's completion percentage
After work has begun on a task, you can quickly record its progress as a percentage. When you enter a completion percentage other than 0, Project 2007 changes the task's actual start date to match its scheduled start date. It then calculates actual duration, remaining duration, actual costs, and other values based on the percentage you enter. For example, if you specify that a four-day task is 50% complete, Project 2007 calculates that it has had two days of actual duration and has two days of remaining duration.
Here are some ways of entering completion percentages:
-
Use the Tracking toolbar (on the View menu, point to Toolbars, and then click Tracking). This toolbar contains buttons for quickly recording that a task is 0, 25, 50, 75, or 100% complete.
-
Enter any percentage value you want in the Update Tasks dialog box (on the Tools menu, point to Tracking, and then click Update Tasks).
Tip: If you can collect the actual start date of a task, it is a good practice to record the actual start date, and then record a completion percentage.
The exercise below explains how to record completion percentages of tasks via the Tracking toolbar.
-
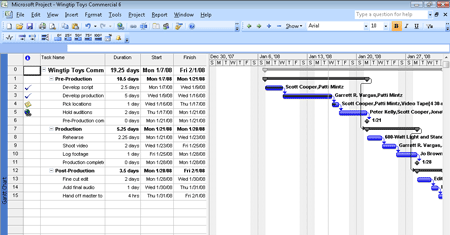
On the View menu, point to Toolbars, and then click Tracking.The Tracking toolbar appears.
-
Click the name of the appropriate task.
-
On the Tracking toolbar, click the 100% Complete button.
Project 2007 records the actual work for the task as scheduled and extends a progress bar through the length of the Gantt bar.
Next, you can get a better look at the task's Gantt bar by entering a completion percentage value for a different task.
-
Click the name of another task.
-
On the Tracking toolbar, click the 50% Complete button.
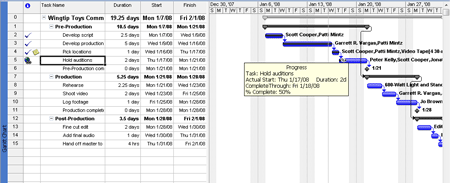
Project 2007 records the actual work for the task as scheduled and then draws a progress bar through part of the Gantt bar. Note that although 50% of task 5 is completed, the progress bar does not span 50% of the width of the Gantt bar. This is because Project 2007 measures duration in working time, but draws the Gantt bars to extend over nonworking time, such as weekends.
Tip: By default, Project 2007 shows Gantt bars in front of nonworking time (such as weekends), like you see in this section. However, Project 2007 can show nonworking time in front of task bars, visually indicating that no work on the task will occur during the nonworking time. If you prefer this type of presentation, click Timescale on the Format menu, and then click the Non-working time tab. Next to Draw, click In front of task bars.
-
In the chart portion (on the right) in the Gantt Chart view, you can hold the mouse pointer over the progress bar of a task's Gantt bar. When the mouse pointer changes to a percent symbol and right arrow, a Progress ScreenTip appears. The Progress ScreenTip informs you of the task's completion percentage and other tracking values.
You have learned how to record actual work that started and finished on schedule. While this might prove true for some tasks, you often need to record actuals for tasks that lasted longer or shorter than planned, or occurred sooner or later than scheduled. This is the subject of the next topic.
Enter actual values for tasks
A more detailed way to keep your schedule up to date is to record what actually happens for each task in your project. You can record each task's actual start, finish, work, and duration values. When you enter these values, Project 2007 updates the schedule and calculates the task's completion percentage. Project 2007 uses the following rules:
-
When you enter a task's actual start date, Project 2007 moves the scheduled start date to match the actual start date.
-
When you enter a task's actual finish date, Project 2007 moves the scheduled finish date to match the actual finish date and sets the task to 100% complete.
-
When you enter a task's actual work value, Project 2007 recalculates the task's remaining work value, if any.
-
When you enter a task's actual duration, if it is less than the scheduled duration, Project 2007 subtracts the actual duration from the scheduled duration to determine the remaining duration.
-
When you enter a task's actual duration, if it is equal to the scheduled duration, Project 2007 sets the task to 100% complete.
-
When you enter a task's actual duration, if it is longer than the scheduled duration, Project 2007 adjusts the scheduled duration to match the actual duration and sets the task to 100% complete.
Suppose that a few more days have passed and work on your project has progressed. In this exercise, you record actual work values for some tasks as well as start dates and durations for other tasks.
-
Click the name of task for which you want to enter work values.
-
On the View menu, point to Table: Entry, and click Work.
The Work table appears. This table includes both the scheduled work (labeled Work) and actual work (labeled Actual) columns. You'll refer to values in both columns as you update tasks.
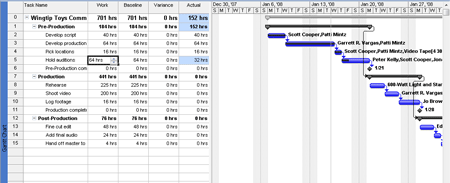
In the chart portion of the Gantt Chart view, you can see that the task you're tracking is partially complete. In the Work table, you can see the actual work value. To record that the task is now complete but required more actual work than expected.
-
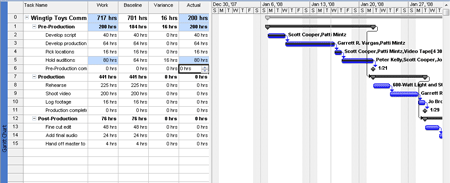
In the Actual field for the task, type or select 80, and then press ENTER.
Project 2007 records that 80 hours of work have been completed on this task. It extends the Gantt bar of the task to indicate its longer duration and reschedules subsequent tasks.
Now suppose that more time has passed. To conclude this project, enter actual start dates and durations of tasks in the Production phase.
-
In the Task Name column, click task 8, Rehearse.
This task started one working day behind schedule (the Wednesday after its scheduled start date) and took a total of two days to complete. You will record this information in the Update Tasks dialog box.
-
On the Tools menu, point to Tracking, and then click Update Tasks.
Tip: You can also click the Update Tasks button on the Tracking toolbar.
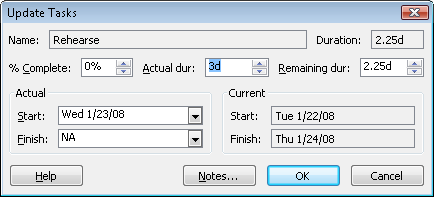
The Update Tasks dialog box appears. This dialog box shows both the actual and scheduled values for the task's duration, start, and finish, as well as its remaining duration. In this box, you can update the actual and remaining values.
-
In the Start field in the Actual box on the left side of the dialog box, type or select the date the task was completed.
-
In the Actual dur field, type or select 3d.
-
Click OK.
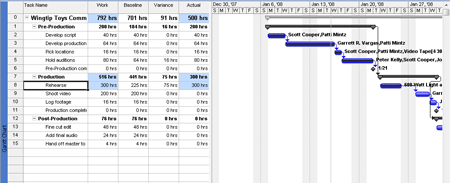
Project 2007 records the actual start date, duration, and scheduled and actual work of the task. These values also roll up to the Production summary task (task 7) and the project summary task (task 0), as indicated by the change highlighting.
The steps below show how to record one of your tasks that was started on time but took longer than planned to complete.
-
In the Task Name column, click the task.
-
On the Tools menu, point to Tracking, and then click Update Tasks. The Update Tasks dialog box appears.
-
In the Actual dur field, type or select 3d, and then click OK. Project 2007 records the actual duration of the task. On the Standard toolbar, click Scroll To Task.
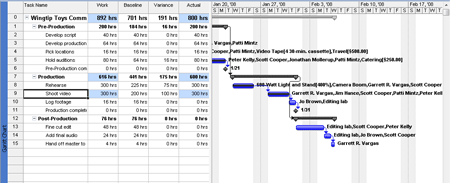
Because you did not specify an actual start date, Project 2007 assumes that the task started as scheduled; yet, the actual duration you entered causes Project 2007 to calculate an actual finish date that is later than the originally scheduled finish date.
-
On the View menu, point to Toolbars and then click Tracking. Project 2007 hides the Tracking toolbar.
Is the project on track?
Properly evaluating a project's status can be tricky. Consider the following issues:
-
For many tasks, it is very difficult to evaluate a completion percentage. When is an engineer's design for a new motor assembly 50% complete? Or when is a programmer's code for a software module 50% complete? Reporting work in progress is in many cases a "best guess" effort and inherently risky.
-
The elapsed portion of a task's duration is not always equal to the amount of work accomplished. For example, a task might require relatively little effort initially, but require more work as time passes. (This is referred to as a back-loaded task.) When 50% of its duration has elapsed, far less than 50% of its total work will have been completed.
-
The resources assigned to a task might have different criteria for what constitutes the task's completion than the criteria determined by the project manager or the resources assigned to successor tasks.
Good project planning and communication can avoid or mitigate these and other problems that arise in project execution. For example, developing proper task durations and status-reporting periods should help you identify tasks that have varied substantially from the baseline early enough to make adjustments. Having well-documented and well-communicated task completion criteria should help prevent "downstream" surprises. Nevertheless, large, complex projects will almost always vary from the baseline.

php programming
ReplyDelete