Show or hide a chart legend or data table
When you create a chart, the legend appears by default, but you can hide the legend or change its location after you create the chart.
You can also show a data table for a line chart, area chart, column chart, or bar chart. A data table displays the values that are presented in the chart in a grid at the bottom of the chart. A data table can also include the legend keys.
Show or hide a legend
-
Click the chart in which you want to show or hide a legend.
-
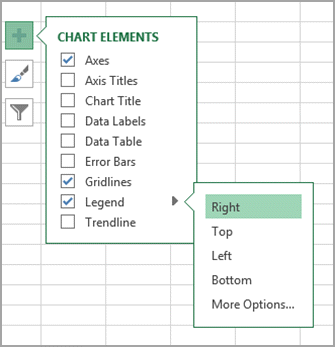
Click the plus sign next to the chart. The Chart Elements menu appears.
-
Do one of the following:
-
To hide the legend, clear the Legend check box.
Tip: To quickly remove a legend or a legend entry from a chart, you can select it, and then press DELETE. You can also right-click the legend or a legend entry, and then click Delete.
-
To display a legend, select the Legend check box if it is not already selected, and then click the arrow next to Legend. Select an option from the list.

Note: When you click one of the display options, the legend moves, and the plot area automatically adjusts to accommodate it. If you move and size the legend by using the mouse, the plot area does not automatically adjust.
-
For additional options, click More Options, and then select the display option that you want from the Format Legend pane.
Tip: By default, a legend does not overlap the chart. If you have space constraints, you may be able to reduce the size of the chart by clearing the Show the legend without overlapping the chart check box.
-
Show or hide a data table
-
Click inside the line chart, area chart, column chart, or bar chart in which you want to show or hide a data table. This displays the Chart Tools.
-
On the Design tab, in the Chart Layouts group, click the arrow next to Quick Layout, and then clickChart 5. A data table will appear on your chart.
To remove the data table, on the Design tab, in the Chart Layouts group, click the arrow next to Quick Layout, and then select a layout that doesn't have a data table.
Tip: To quickly remove a data table from a chart, you can select it, and then press DELETE. You can also right-click the data table, and then click Delete.
Note: In bar charts and charts that display a date axis, the data table is not attached to the horizontal axis of the chart — it is placed below the axis and aligned to the chart.
Show or hide a legend
-
Click the chart in which you want to show or hide a legend.
This displays the Chart Tools, adding the Design, Layout, and Format tabs.
-
On the Layout tab, in the Labels group, click Legend.

-
Do one of the following:
-
To hide the legend, click None.
Tip: To quickly remove a legend or a legend entry from a chart, you can select it, and then press DELETE. You can also right-click the legend or a legend entry, and then click Delete.
-
To display a legend, click the display option that you want.
Note: When you click one of the display options, the legend moves, and the plot area automatically adjusts to accommodate it. If you move and size the legend by using the mouse, the plot area does not automatically adjust.
-
For additional options, click More Legend Options, and then select the display option that you want.
Tip: By default, a legend does not overlap the chart. If you have space constraints, you may be able to reduce the size of the chart by clearing the Show the legend without overlapping the chart check box.
-
Show or hide a data table
-
Click the chart of a line chart, area chart, column chart, or bar chart in which you want to show or hide a data table.
This displays the Chart Tools, adding the Design, Layout, and Format tabs.
-
On the Layout tab, in the Labels group, click Data Table.

-
Do one of the following:
-
To display a data table, click Show Data Table or Show Data Table with Legend Keys.
-
To hide the data table, click None.
Tip: To quickly remove a data table from a chart, you can select it, and then press DELETE. You can also right-click the data table, and then click Delete.
-
For additional options, click More Data Table Options, and then select the display option that you want.
Tip: If you already display a legend in the chart, you can clear the Show legend keys check box.
-
Note: In bar charts and charts that display a date axis, the data table is not attached to the horizontal axis of the chart — it is placed below the axis and aligned to the chart.
No comments:
Post a Comment