Power View and Power Pivot videos
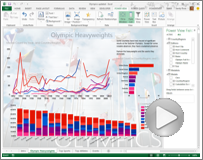
Here's a collection of videos about Power View and Power Pivot in Microsoft Excel 2013.
| Get started with Power View | |
| More about creating Power View sheets in Excel 2013. |
| Create visualizations | |
| Bubble and scatter charts More about bubble and scatter charts. | Pie charts More about pie charts. |
| Multiples More about multiples. | Cards More about cards. |
| Tiles More about tiles. | Matrix More about matrices. |
| Maps | |
| Create maps More about maps. | Fix ambiguous map data More about maps. |
| Explore data | |
| Filters More about filters and highlighting. | Highlighting More about highlighting. |
| Slicers More about slicers. | Sort More about sorting. |
| Refresh data and the data model More about refreshing the data or data model. |
| Hierarchies | |
| Drill down in an ad-hoc hierarchy More about drill-down. | Drill down with a hierarchy in the model More about drill-down. |
| Work with hierarchies More about hierarchies. |
| Power Pivot | |
| Set default fields | Hide columns and tables More about hiding tables, columns, and fields from PivotTables and Power View. |
| Add descriptions to columns and tables More about adding descriptions to Power Pivot tables, columns, and fields. | Relationships More about relationships in Power View. |
| Summarize by More about setting default aggregations. |
See also
Power Pivot: Powerful data analysis and data modeling in Excel
Power View: Explore, visualize, and present your data
Tutorial: PivotTable data analysis using a Data Model in Excel 2013


No comments:
Post a Comment