Project values in a series
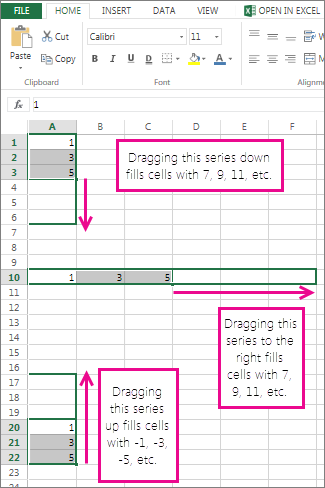
In Excel Online, you can project values in a series by using worksheet functions, or you can click and drag the fill handle to create a linear trend of numbers. But you can't create a growth trend by using the fill handle.
Here's how you use the fill handle to create a linear trend of numbers in Excel Online:
-
Select at least two cells that contain the starting values for the trend.
If you want to increase the accuracy of the trend series, select additional starting values.
-
Drag the fill handle in the direction that you want to fill with increasing values or decreasing values.

Use functions to project values
The FORECAST function calculates, or predicts, a future value based on existing values. The predicted value is a y-value for a given x-value. The known values are existing x-values and y-values, and the new value is predicted by using linear regression. You can use this function to predict future sales, inventory requirements, and consumer trends.
The TREND and GROWTH functions can predict future y-values that extend a straight line or exponential curve that best describes the existing data. They can also return only the y-values based on known x-values for the best-fit line or curve. To plot a line or curve that describes existing data, use the existing x-values and y-values returned by the TREND or GROWTH function.
You can use the LINEST or LOGEST function to calculate a straight line or exponential curve from existing data. The LINEST function and LOGEST functions return various regression statistics, including the slope and intercept of the best-fit line.
No comments:
Post a Comment