Add axis titles to a chart in Office 2016
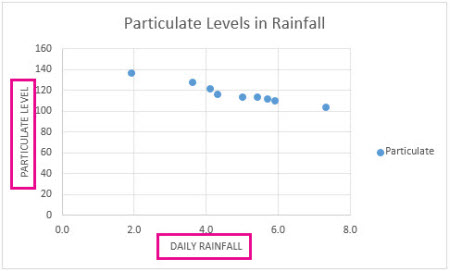
When you create a chart, you can add axis titles to any horizontal, vertical, or depth axes in the chart. The titles will help the people who view the chart understand the data. You can't add axis titles to charts that don't have axes (like pie or doughnut charts).

-
Click anywhere in the chart you want to add axis titles to.
-
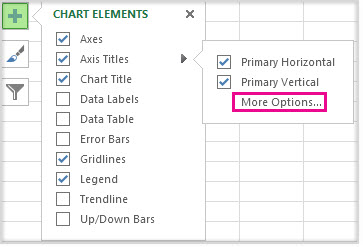
Click the Chart Elements button
 next to the upper-right corner of the chart.
 -
To add primary horizontal and vertical axis titles, check the Axis Titles box.
-
To add depth or secondary axis titles, click the arrow next to Axis Titles, and then click More Options.

-
Click each Axis Title box in the chart, and then type the text you want.
To start a new line in the title, press Shift+Enter.
Tip: To format the axis titles, right-click them, click Format Axis Title, and then pick the formatting options you want.
Link axis titles to text on the worksheet
To use text on the worksheet for your axis titles, you link the axis titles to the worksheet cells that contain the text. Linked titles are automatically updated in the chart when you change the corresponding text on the worksheet.
-
On the chart, click an Axis Title box.
-
On the worksheet, click inside the formula bar, and then type an equal sign (=).
-
Select the worksheet cell that contains the text to use for the axis title and then press Enter.
Tip: In addition to changing the text of axis titles, you can change the axis labels. You can also add a chart title to your chart.
No comments:
Post a Comment