Sunday, July 1, 2018

Change the layout or style of a chart
Change the layout or style of a chart
After you create a chart, you can instantly change its look. Instead of manually adding or changing chart elements or formatting the chart, you can quickly apply a predefined layout and style to your chart. Office provides a variety of useful predefined layouts and styles (or quick layouts and quick styles) that you can select from. However, you can customize a layout or style of a chart further by manually changing the layout and style of the individual chart elements that are used in the chart.
You cannot save a custom layout or format, but if you want to use the same layout or format again, you can save the chart as a chart template.
Important: To complete the following procedures, you must have an existing chart. For more information about how to create a chart, see Create a chart.
Select a predefined chart layout
-
Click the chart that you want to format.
This displays the Chart Tools, adding the Design, Layout, and Format tabs.
-
On the Design tab, in the Chart Layouts group, click the chart layout that you want to use.
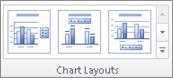
Note: When the Excel window is reduced in size, chart layouts will be available in the Quick Layout gallery in the Chart Layouts group.
Tip: To see all available layouts, click More
 .
Select a predefined chart style
-
Click the chart that you want to format.
This displays the Chart Tools, adding the Design, Layout, and Format tabs.
-
On the Design tab, in the Chart Styles group, click the chart style that you want to use.
Tip: To see all predefined chart styles, click More
.
Note: When the Excel window is reduced in size, chart styles will be available in the Chart Quick Styles gallery in the Chart Styles group.
Tip: Chart styles use the colors of the current document theme that is applied to the workbook. You can change the colors by switching to a different document theme. You can also customize a document theme to display a chart in the exact colors that you want.
Change the layout of chart elements manually
-
Click anywhere in the chart or click the chart element that you want to change.
This displays the Chart Tools, adding the Design, Layout, and Format tabs.
-
On the Layout tab, do the one or more of the following:
-
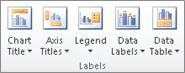
In the Labels group, click a layout option for the chart label that you want to change.
-
In the Axes group, click a layout option for the axis or gridlines that you want to change.

-
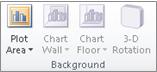
In the Background group, click a layout option for the background that you want to change.
Options for chart walls, floors, and 3-D rotation are available on 3-D charts only.
-
In the Analysis group, click a layout option for any lines or bars that you want to add or change.
Depending on the chart type of your chart, some analysis options may or may not be available.
Note: The layout options that you select are applied to the element that you have selected. For example, if you have the whole chart selected, data labels will be applied to all data series. If you have a single data point selected, data labels will only be applied to the selected data series or data point.
-
Tips:
-
On the Layout tab, you can also find options to add pictures, shapes, or text boxes (Insert group), and you can change the name of your chart (Properties group).
-
To change the format of a specific chart element, you can right-click that chart element, and then click Format <Chart element>.
Change the formatting style of chart elements manually
-
Click the chart element that you want to change or do the following to select it from a list of chart elements:
-
Click the chart.
This displays the Chart Tools, adding the Design, Layout, and Format tabs.
-
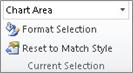
On the Format tab, in the Current Selection group, click the arrow in the Chart Elements box, and then click the chart element for which you want to change the formatting style.
-
-
On the Format tab, do one of the following:
-
In the Current Selection group, click Format Selection, and then in the Format <Chart element> dialog box, select the formatting options that you want.
-
In the Shape Styles group, click the More button
, and then select a style.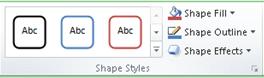
-
In the Shape Styles group, click Shape Fill, Shape Outline, or Shape Effects and then select the formatting options that you want.
-
In the WordArt Styles group, click a WordArt Style option, or click Text Fill, Text Outline, or Text Effects, and then select the text formatting options that you want.
-
Tip: To change the format of a specific chart element, you can right-click that chart element, and then click Format <Chart element>.
Save a chart as a chart template
If you want to create another chart such as the one that you just created, you can save the chart as a template that you can use as the basis for other similar charts.
-
Click the chart that you want to save as a template.
This displays the Chart Tools, adding the Design, Layout, and Format tabs.
-
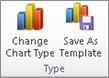
On the Design tab, in the Type group, click Save as Template.
-
In the File name box, type a name for the template.
Tip: Unless you specify a different folder, the template file (.crtx) will be saved in the Charts folder, and the template becomes available under Templates in both the Insert Chart dialog box (Insert tab, Charts group, Dialog Box Launcher
 ) and the Change Chart Type dialog box (Design tab, Type group, Change Chart Type).
Note: A chart template contains the chart format and stores the colors that are in use when you save the chart as a template. When you use a chart template to create a chart in another workbook, the new chart uses the colors of the chart template — not the colors of the document theme that is currently applied to the workbook. To use the document theme colors instead of the chart template colors, right-click the chart area, and then click Reset to Match Style.
Tips for improving audio and video playback and compatibility in PowerPoint
Tips for improving audio and video playback and compatibility in PowerPoint
If you experience slow playback, a lag between audio and video, audio stuttering, and frames being lost, there are a few tips that may be able to help you to improve the audio and video playback and compatibility of any media you include in your presentation.
Tip: Certain older video file formats may not compress or export properly in Office on a Windows RT PC. We recommend using newer media formats like H.264 and Advanced Audio Coding (AAC). Want to know what version of Office you are using?
Improve performance when using video and special effects
-
Compress the media files in your presentation to help decrease the size of your presentation.
-
Limit the use of special effects like shadows, reflections, glow effects, soft edges, bevels, and 3-D rotation, in your video.
Improve compatibility and playback with hardware
-
Install more memory or insert a more powerful graphics card on your computer.
-
If you are using Vista or Windows 7.0, look at the Windows Experience Index in Windows to see what areas you can improve.
The Windows Experience Index measures the capability of your computer's hardware and software configuration, providing a measurement in the form of a 'base score'. A higher base score generally means that your computer will perform better and faster than a computer with a lower base score. See Windows Help and Support for more information.
-
Make sure your video card drivers are up to date. You'll need to contact the manufacturer of your video card or go online to their web site and verify this.
-
Turn hardware acceleration on. To do this in PowerPoint, go to File > Options > Advanced, and then under Display, make sure the Disable hardware graphics acceleration checkbox is clear.
-
Check that there's enough free disk space on the device that you'll deliver your presentation on.
-
Change the color depth setting to 16-bit. Color depth is the number of color values that are assigned to a single pixel in an image. Color depth can range from 1 bit (black and white) to 32 bits (over 16.7 million colors).
-
Close all other programs.
Considerations for linking to or embedding media files
-
It's a good idea to embed media files rather than link to them. Embedding media files will guarantee their playback, however it will increase the file size of the presentation. But you can compress the media files in your presentation.
-
If you must link to videos, make sure that you have a working network connection at the site where you plan to deliver your presentation. Also, be sure to test the connection before presenting. This will help you to identify problems before you start the presentation. The benefit of linking to the media is that the presentation file size will be smaller. However, be sure to copy the linked media files into the same directory as the presentation so that they will play.
Improve compatibility of media with earlier versions of PowerPoint
If your presentation contains a video or sound file from an earlier version of PowerPoint, you can upgrade your file format to take advantage of improved multimedia playback capabilities. Upgrading will automatically update and embed media items. To upgrade a file format in PowerPoint, on the File tab, select Info, and then Convert Document.
Double-clicking a legacy video will display a dialog box that will allow you to upgrade your video files.
Clean out your TEMP folder
If you have a lot of files in your TEMP folder, it can slow PowerPoint (and other programs) down dramatically. So you'll want to periodically check and delete excess files in your TEMP folder.
To find your TEMP folder, do the following:
-
Close PowerPoint and all other programs you are using.
-
Select Start.
-
Select Run.
-
In the Open box, type %temp%.
-
Select OK.
-
Select the excess .tmp files, and then press DELETE.
You can usually delete any files that you find in your TEMP folder. If you get an "access error" message, it's most likely because you're attempting to delete a file that is in use.
Create a UML component diagram
Create a UML component diagram
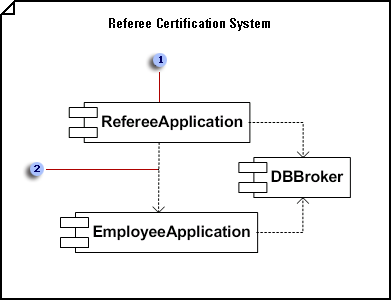
 In a component diagram, components are generic types rather than instances. To show component instances, use a deployment diagram.
 Dependencies indicate that a client component is dependent upon a supplier component in some way.
-
On the File menu, point to New, point to Software, and then click UML Model Diagram.
-
In the tree view, right-click the package or subsystem in which you want to include the component diagram, and then on the New menu, click Component Diagram.
A blank page appears, and the UML Component stencil becomes the top-most stencil. The workspace displays 'Component' as a watermark. An icon representing the diagram is added to the tree view.
Note: If the tree view isn't visible, point to View on the UML menu, and then click Model Explorer.
-
Drag a Component shape onto the drawing page for each component you want to represent.
-
Where appropriate, drag an Interface shape onto the drawing page and glue the endpoint without the circle to a component shape.
Add an interface to a class, component, or other elements
-
In a static structure, component, or deployment diagram, drag the lollipop Interface shape onto the drawing page.
-
Glue the endpoint without the circle to a connection point
 on the class component, or other element.
-
Double-click the Interface shape to add a name, operations, and other property values.
tiplist
You can also represent an interface with a rectangular Interface shape that resembles a class. Use this shape when you want to display a list of the interface operations.
To change the type of shape that displays for an interface, right-click the Interface shape and click Show as Class-like Interface or Show as Lollipop Interface.
-
-
Use Dependency shapes to indicate the relationships between components or between one component and another component's interface.
Indicate a dependency relationship between UML elements
-
Drag a Dependency shape from the UML Static Structure, UML Deployment, or UML Component stencil onto the drawing page and place it near the elements you want to relate.
-
Glue the endpoint with an arrowhead to a connection point
on the element the other element depends on. Glue the endpoint without an arrowhead to a connection point on the element that depends on the other element. -
Double-click the dependency to add a name, stereotype, and other properties.
Tip: If you want to indicate a trace, refinement, usage, or binding dependency, you can use the Trace, Refinement, Usage, or Binding shapes from the UML Static Structure stencil.
-
-
Double-click any shape to open its UML Properties dialog box where you can add a name, attributes, operations, and other properties.
-
Save the diagram.
Look up values in a list of data
Look up values in a list of data
Let's say that you want to look up an employee's phone extension by using their badge number, or the correct rate of a commission for a sales amount. You look up data to quickly and efficiently find specific data in a list and to automatically verify that you are using correct data. After you look up the data, you can perform calculations or display results with the values returned. There are several ways to look up values in a list of data and to display the results.
What do you want to do?
-
Look up values vertically in a list by using an approximate match
-
Look up values vertically in a list of unknown size by using an exact match
-
Look up values horizontally in a list by using an exact match
-
Look up values horizontally in a list by using an approximate match
-
Create a lookup formula with the Lookup Wizard (Excel 2007 only)
Look up values vertically in a list by using an exact match
To do this task, you can use the VLOOKUP function, or a combination of the INDEX and MATCH functions.
VLOOKUP examples

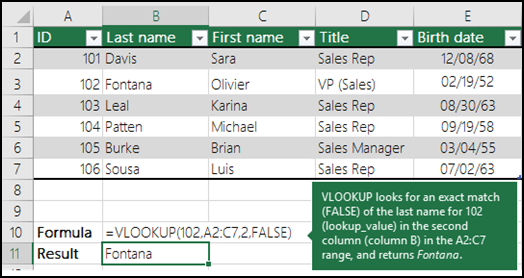
For more information, see VLOOKUP function.
INDEX and MATCH examples
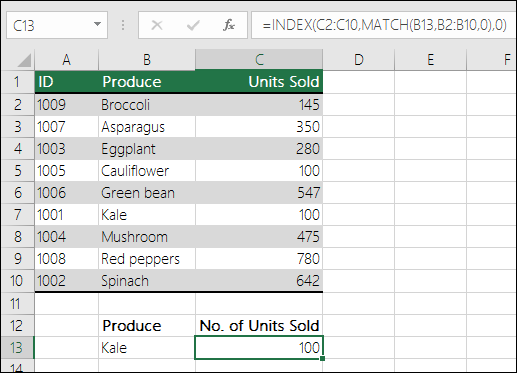
In simple English it means:
=INDEX(I want the return value from C2:C10, that will MATCH(Kale, which is somewhere in the B2:B10 array, where the return value is the first value corresponding to Kale))
The formula looks for the first value in C2:C10 that corresponds to Kale (in B7) and returns the value in C7 (100), which is the first value that matches Kale.
For more information, see INDEX function and MATCH function.
Look up values vertically in a list by using an approximate match
To do this, use the VLOOKUP function.
Important: Make sure the values in the first row have been sorted in an ascending order.
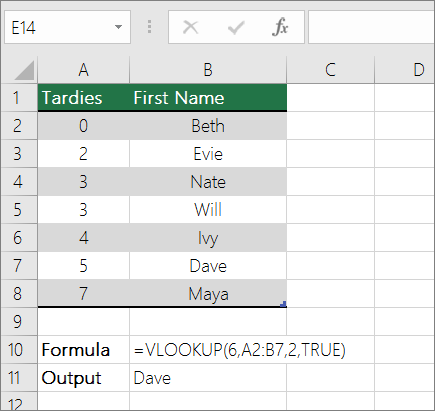
In the above example, VLOOKUP looks for the first name of the student who has 6 tardies in the A2:B7 range. There is no entry for 6 tardies in the table, so VLOOKUP looks for the next highest match lower than 6, and finds the value 5, associated to the first name Dave, and thus returns Dave.
For more information, see VLOOKUP function.
Look up values vertically in a list of unknown size by using an exact match
To do this task, use the OFFSET and MATCH functions.
Note: Use this approach when your data is in an external data range that you refresh each day. You know the price is in column B, but you don't know how many rows of data the server will return, and the first column isn't sorted alphabetically.
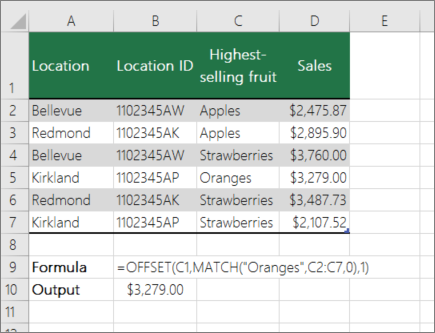
C1 is the upper left cells of the range (also called the starting cell).
MATCH("Oranges",C2:C7,0) looks for Oranges in the C2:C7 range. You should not include the starting cell in the range.
1 is the number of columns to the right of the starting cell where the return value should be from. In our example, the return value is from column D, Sales.
Look up values horizontally in a list by using an exact match
To do this task, use the HLOOKUP function. See an example below:
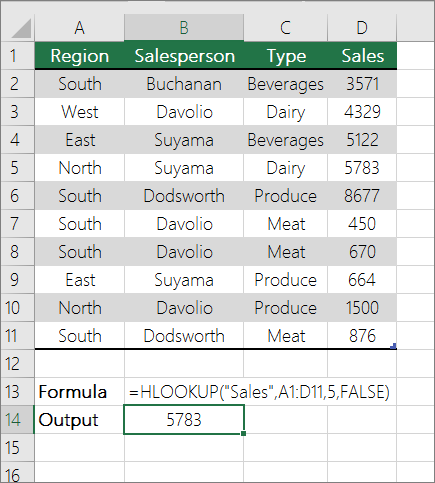
HLOOKUP looks up the Sales column, and returns the value from row 5 in the specified range.
For more information, see HLOOKUP function.
Look up values horizontally in a list by using an approximate match
To do this task, use the HLOOKUP function.
Important: Make sure the values in the first row have been sorted in an ascending order.
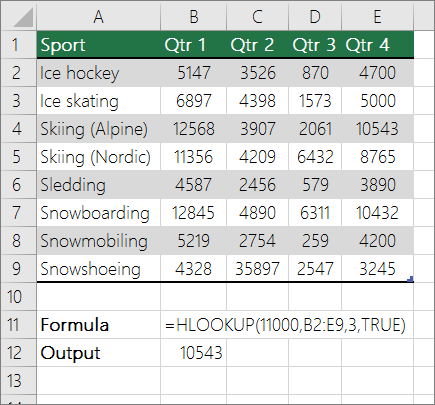
In the above example, HLOOKUP looks for the value 11000 in row 3 in the specified range. It does not find 11000 and hence looks for the next largest value less than 1100 and returns 10543.
For more information, see HLOOKUP function.
Create a lookup formula with the Lookup Wizard (Excel 2007 only)
Note: The Lookup Wizard add-in was discontinued in Excel 2010. This functionality has been replaced by the function wizard and the available Lookup and reference functions (reference).
In Excel 2007, the Lookup Wizard creates the lookup formula based on a worksheet data that has row and column labels. The Lookup Wizard helps you find other values in a row when you know the value in one column, and vice versa. The Lookup Wizard uses INDEX and MATCH in the formulas that it creates.
-
Click a cell in the range.
-
On the Formulas tab, in the Solutions group, click Lookup.
-
If the Lookup command is not available, then you need to load the Lookup Wizard add-in program.
How to load the Lookup Wizard Add-in program
-
Click the Microsoft Office Button
 , click Excel Options, and then click the Add-ins category.
-
In the Manage box, click Excel Add-ins, and then click Go.
-
In the Add-Ins available dialog box, select the check box next to Lookup Wizard, and then click OK.
-
Follow the instructions in the wizard.
Apply a professional look to your drawings with themes
Apply a professional look to your drawings with themes
What do you want to do?
A theme in Microsoft Office Visio 2007 is a set of colors and effects that you can apply to a drawing with a single click. Themes are a quick and easy way to give your drawings a fresh and professionally designed look.
A theme has two parts:
-
Theme colors—a set of colors designed to work well together
-
Theme effects—a set of effects for font, fills, shadows, lines, and connectors
You can mix and match theme colors and effects in any combination.
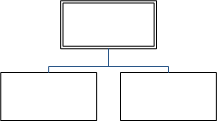
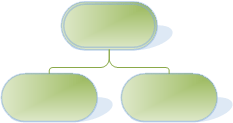
Microsoft Office Visio comes with a set of built-in themes, but you can also create and edit custom themes. For example, you can create a custom theme to match your company's logo and branding.
The built-in theme colors match the theme colors available in other Microsoft Office applications, such as PowerPoint and Word.
Apply a theme
-
On the Format menu, click Theme. The Theme - Colors task pane opens by default. To open the Theme - Effects task pane, click Theme Effects.
Tip: You can also click the Theme tool on the Formatting toolbar.
-
Do one of the following:
-
To apply a theme to the current drawing page, right-click a thumbnail, and then click Apply to Current Page.
-
To apply a theme to all the pages in your drawing, right-click a thumbnail, and then click Apply to All Pages.
Tip: You can also click a thumbnail. Clicking a thumbnail applies the theme either to the current page or to all pages in your drawing, depending on what you did last.
Notes:
-
To remove the current theme colors or theme effects from all shapes, in the Theme task pane, click the None thumbnail.
-
Some themes apply a background color to your drawing. If you don't want the background color to appear when you print, select the No Background check box in the Print dialog box.
-
To enlarge the thumbnails, right-click a thumbnail, and click Show Large Previews.
-
After you apply a theme, that theme is applied to any shapes you add to the drawing. To temporarily disable this functionality, clear the Apply theme to new shapes check box at the bottom of the Themes task pane.
-
-
Create a custom theme
-
In the Theme task pane, click New theme colors or New theme effects.
-
In the New Theme Colors or New Theme Effects dialog box, choose the colors or effects you want, and click OK.
Tip: Before you create a custom theme, first apply a theme that is similar to the theme you want to create. Then, when you open the New Theme Colors or New Theme Effects dialog box, most of your choices will already have been made.
Duplicate a theme
-
In the Theme task pane, right-click the thumbnail for the theme you want to duplicate, and then click Duplicate. The duplicated theme is added to the Theme task pane under Custom.
Edit a custom theme
-
In the Theme task pane, right-click the thumbnail for the custom theme you want to edit, and then click Edit.
-
In the Edit Theme Colors or Edit Theme Effects dialog box, choose the options you want, and click OK.
Note: You can't edit the built-in themes that are included with Visio. If you want to make a change to one of the built-in themes, duplicate it and then edit the duplicate theme.
Copy a custom theme to another drawing
-
Open the drawing that has the custom theme you want to copy.
-
Select a shape with the custom theme applied.
-
On the Edit menu, click Copy.
-
Open the drawing that you want to copy the custom theme to.
-
On the Edit menu, click Paste. The custom theme is added to the Themes task pane.
-
You can now delete the shape that you pasted into your drawing.
Note: You cannot copy a theme from another Microsoft Office program, such as PowerPoint or Word, to Visio. You also cannot copy a theme from Visio to another Microsoft Office program.
Prevent themes from affecting a shape
You may not want a theme to apply to every shape in a drawing. For example, if you have a traffic sign in your drawing, you probably don't want its fill color or pattern to change when you apply a theme.
To prevent themes from applying to a specific shape you can either not allow themes for that shape, or you can protect the shape from theme colors or theme effects.
Not allow themes for a shape
-
Right-click the shape, point to Format, and uncheck the Allow Themes command.
Protect a shape from theme colors or theme effects
-
Select the shape.
-
On the Format menu, click Protection.
-
In the Protection dialog box, select the From theme colors or From theme effects check boxes.
Notes:
-
If you want to use a text, line, or fill color that doesn't change when you apply a theme, click the arrow next to the Text Color, Line Color, or Fill Color tool on the Formatting toolbar, and then select one of the colors under Standard Colors.
-
Some of the shapes that are included with Visio are not affected by themes by default. Allowing themes to affect these shapes can cause unexpected results.
-
Remove a theme from a shape
-
Right-click the shape, point to Format, and click Remove Theme.
Tip: To remove the current theme colors or theme effects from all shapes, in the Theme task pane, click the None thumbnail.
Delete a custom theme
-
In the Theme task pane, right-click the thumbnail for the custom theme you want to delete, and then click Delete.
Note: You can't delete the built-in themes that are included with Visio.
Open an existing OneNote for Windows 8 notebook from OneDrive
Open an existing OneNote for Windows 8 notebook from OneDrive
If you already have notebooks stored on OneDrive, you can open them in OneNote for Windows 8.
-
On any page, tap the gripper icon next to Recent Notes in the top left corner.
-
In the gray pane that appears on the left, tap More….
-
Tap the name of the notebook you want to open.
-
Go to the OneDrive home page and sign in with your Microsoft account, if prompted.
-
Tap and hold on the notebook you want to open and then select Open in OneNote from the context menu.