Import data to shapes in your drawing
With Visio Professional, you can import data from external sources. When you import, a row of data gets linked, or associated, to a shape. After the data is imported, you can apply data graphics to the shapes which visualize the values. If these terms sound new to you, see Importing data into Visio, an overview.
Tip: To make the import process go smoothly, make sure that one column of your data contains unique values for each row, and that the values match the text on the shapes. This will allow Visio to find a match between the rows and the shapes.
Quick import of an Excel workbook
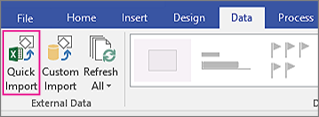
The most popular data source to import is an Excel workbook. That's why there is a Quick Import button for this source.
-
On the Data tab, click Quick Import.

-
Click Browse, and then select the workbook you want to import. Click Open, and then click Done.
-
If the Import to Visio box and the Excel program appear, click the sheet tab where your data is, and then drag to select your data. Make sure to include any headers above the columns. Then, in the Import to Visio box, click Import, and then click Done.
-
Do one of the following:
-
If you see data graphics on each and every shape, Visio was able to automatically link rows to the shapes. Check out the "Next steps" at the bottom of this article.
-
If you don't see data graphics on all the shapes, Visio wasn't able to link some rows to some shapes. See "Link rows to shapes" below.
-
Custom import process for all data sources
If the Quick Import option didn't work as you expect, or you have another data source to import, can do a custom import of your data. Here's how:
-
On the Data tab, click Custom Import.
-
On the first page of the Data Selector wizard, choose a data source, and then click Next.
-
Click Browse, and then select the source you want to import, and then click Next.
-
If you chose an Excel workbook, choose the sheet, select the range of cells, and specify if your data includes column headings. Click Next, and then specify the columns and rows to include. Click Next.
-
On the Configure Refresh Unique Identifier page, select the check box for the column that contains unique values. If you decide to refresh the imported data later, this unique identifier will enable Visio to find the updated row in the source, retrieve it, and then update the diagram. Click Next.
-
After you click Finish on the last page of the Data Selector wizard, the External Data window appears with your imported data shown in a table.
-
See "Link rows to shapes" below.
Link rows to shapes
If you've imported data into a Visio diagram, you can always see the data in the External Data Window. And you can link those data rows to shapes. Here's how:
-
Click the Data tab.
-
Then click the External Data Window check box.
-
To link a data row to a shape, drag the row to a shape. Here's how:

There are other ways to link rows to shapes, see Tips and tricks for linking data.
Next steps
-
You can change the data graphics that are associated with the shapes.
-
You can also move data graphics.
-
You can refresh the imported data within the diagram. Click Data > Refresh All. However, please note that any changes made in the Shape Data window do not get pushed back to the source.
No comments:
Post a Comment