Power Pivot reporting properties: Adding descriptions to Power View tables, columns, and fields
In Power Pivot you can add descriptions for the tables, fields, and columns in Power View. When working in Power View, these descriptions will appear when you hover on the table, field, or column. By adding descriptions for tables, fields, and measures, you'll make it easier for coworkers to create reports and also easier for others to understand and use your shared reports.

-
Open Power Pivot > Manage.
-
Select the Data View: Home > View > Data View
-
To add a description to a:
-
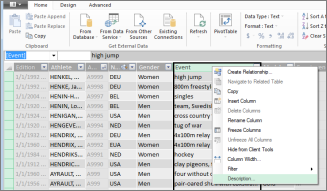
Column: select the column, right-click, and select Description.

-
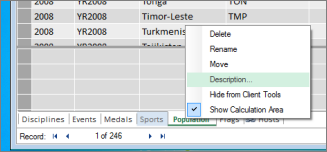
Table: right-click the table tab and select Description.

-
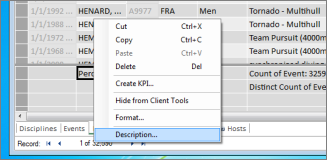
Field: right-click the calculated field (or measure) and select Description.

-
-
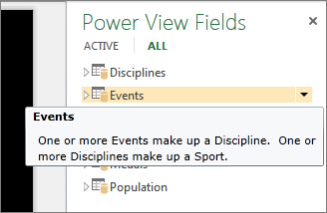
Back in Power View, hover over the table, field, or column to display the description.

Note: When you add descriptions in Power Pivot, you are making changes to the underlying data model. So when you return to Power View, you'll be prompted to refresh the data in your workbook.
See Also
Power Pivot reporting properties for Power View
Power View and Power Pivot videos
Power View: Explore, visualize, and present your data
Tutorial: PivotTable data analysis using a Data Model in Excel
No comments:
Post a Comment