Sort a chart in Power View
In Power View you can organize your data in a chart with one click. You can sort chart categories by a category value (in the Axis box) or by a numeric value (in the Values box).
-
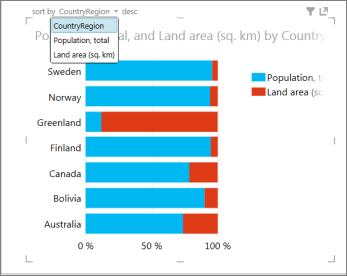
Hover over the top edge of a chart until you see sort by in the upper-left corner, then the name of a field, and then either asc or desc.
-
Click the field name to sort on a different value.

-
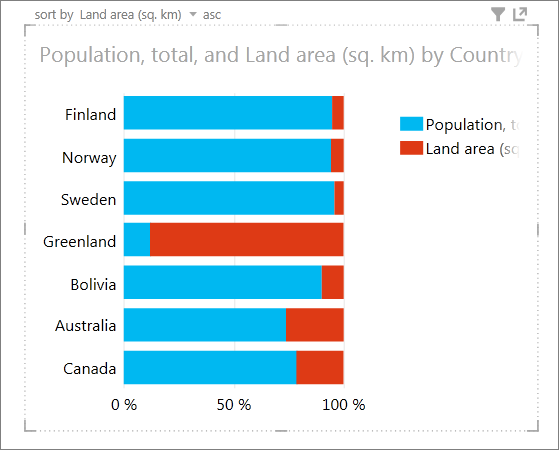
Click asc or desc to sort in the opposite direction.
Chart sorted descending on the CountryRegion category value by default.

Chart sorted ascending by the Land area value.

Note: You can't disable sorting. People viewing your Power View sheets will be able to sort the charts.
Charts you can and can't sort
Some charts can't be sorted. Others can't be sorted as individual charts, but when used in multiples, the multiples can be sorted as shown in the following table.
| Chart type | Can be sorted | Multiples can be sorted |
| Column | Yes | Yes |
| Bar | Yes | Yes |
| Line | No | Yes |
| Scatter or bubble | No | Yes |
| Stacked column or bar | Yes | Yes |
| 100% stacked column or bar | Yes | Yes |
| Scatter or bubble with play axis | No | No |
See Also
Charts and other visualizations in Power View
Power View and Power Pivot videos
Tutorial: PivotTable data analysis using a Data Model in Excel 2013
No comments:
Post a Comment