Note: We are removing an option described in this topic soon. Please see below for details.
Suppose that you have a workbook that contains some great information, and you want to share it with other people in your organization. SharePoint supports browser view options that you specify in Excel 2013. This enables you to choose how you want the workbook to display when people view it in a browser window. You can:
The following sections provide an overview of these options how to specify the browser view options you want to use.
Display a workbook using gallery view
Note: We are removing this option soon. We recommend you stop using it.
When you specify a workbook to be displayed using gallery view, it looks like this in a browser window:

How gallery view works
In this view, one item, such as a PivotChart is displayed in the center of the screen, and other items are displayed as thumbnail images along the right-hand side of the screen. Here, an "item" is typically a PivotChart, such as the pie chart that is shown above. An item can also be a PivotTable or a range of cells that is defined as a named item.
Slicers and timeline controls are displayed along the left-hand side of the screen. Each filter applies to all the items that are connected to it, including charts and tables that are displayed as thumbnails.
To view a different item in the center of the screen, you click (or tap) its thumbnail.
To specify the workbook to display using gallery view
-
In Excel, on the File tab, choose Browser View Options.
-
On the Show tab, use the list to select Items in the Workbook.
-
Select the named items that you want to publish, and then choose the Parameters tab.
-
If the workbook contains slicers or timeline controls, click Add, select the slicers that you want to publish, and then choose OK.
-
Choose OK to close the Browser View Options dialog box.
-
Save and close the workbook.
-
Upload the workbook to a SharePoint library, such as the Documents library.
Display a workbook using worksheet view
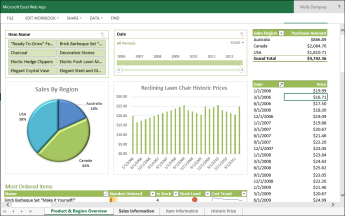
When you specify a workbook to be displayed using worksheet view, it looks like this in a browser window:

How worksheet view works
In this view, an entire worksheet is displayed on the screen, similar to how it looks in Excel. This view works well for dashboards that are created in Excel, because you can see all the charts and tables on the screen in a single view. When you use a filter, such as a slicer or timeline control, you can see all the items that are connected to that filter refresh to display that information.
You can see tabs across the bottom representing additional worksheets in the workbook. To view a different worksheet, click its tab.
To specify a workbook to display using worksheet view
-
In Excel, on the File tab, choose Browser View Options.
-
On the Show tab, use the list to select Sheets. Select the worksheets that you want to display, and then choose OK.
-
Save and close the workbook.
-
Upload the workbook to a SharePoint library, such as the Documents library.
Displaying a workbook in an Excel Web Access Web Part
When you display a workbook in an Excel Web Access Web Part, it looks like this in a browser window:

Here, the Excel Web Access Web Part is a container that displays Excel content in a SharePoint site. You don't have to click to open the workbook for viewing; in the Web Part, the content is displayed as part of page.
You can display an entire worksheet or a single item in an Excel Web Access Web Part. In the image shown above, an entire worksheet is displayed, but you could also display a single chart, such as a pie chart.
For more information, see Display Excel content in an Excel Web Access Web Part.
No comments:
Post a Comment