After creating a chart, you might need to add an additional data series to the chart. A data series is a row or column of numbers that are entered in a worksheet and plotted in your chart, such as a list of quarterly business profits.
Charts in Office are always associated with an Excel-based worksheet, even if you created your chart in another program, such as Word. If your chart is on the same worksheet as the data you used to create the chart (also known as the source data), you can quickly drag around any new data on the worksheet to add it to the chart. If your chart is on a separate sheet, you'll need to use the Select Data Source dialog box to add a data series.
Note: If you're looking for information about adding or changing a chart legend, see Add a legend to a chart.
Add a data series to a chart on the same worksheet
-
On the worksheet that contains your chart data, in the cells directly next to or below your existing source data for the chart, enter the new data series you want to add.
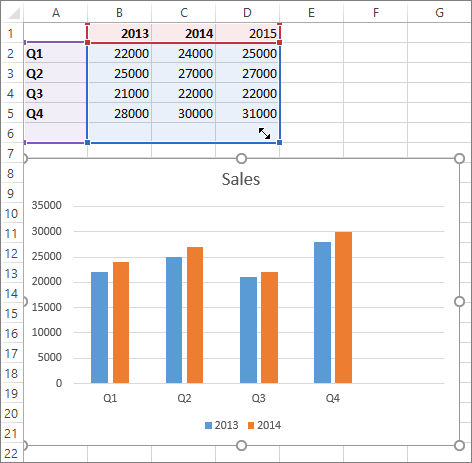
In this example, we have a chart that shows 2013 and 2014 quarterly sales data, and we've just added a new data series to the worksheet for 2015. Note that the chart does not yet display the 2015 data series.

-
Click anywhere in the chart.
The currently displayed source data is selected on the worksheet, showing sizing handles.
You can see that the 2015 data series is not selected.

-
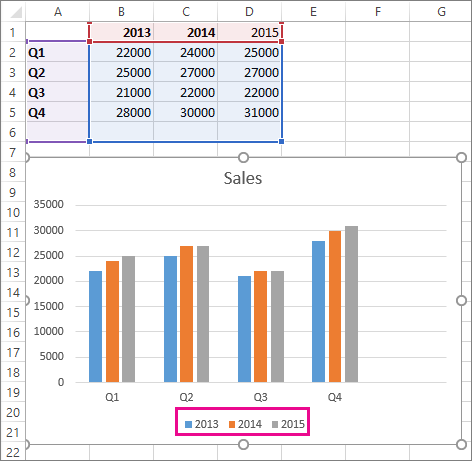
On the worksheet, drag the sizing handles to include the new data.

The chart is updated automatically and shows the new data series you added.

Notes: If you just want to show or hide the individual data series that are displayed in your chart (without changing the data), see:
Add a data series to a chart on a separate chart sheet
If your chart is on a separate worksheet, dragging might not be the best way to add a new data series. In that case, you can enter the new data for the chart in the Select Data Source dialog box.
-
On the worksheet that contains your chart data, in the cells directly next to or below your existing source data for the chart, enter the new data series you want to add.
-
Click the worksheet that contains your chart.
-
Right-click the chart, and then choose Select Data.

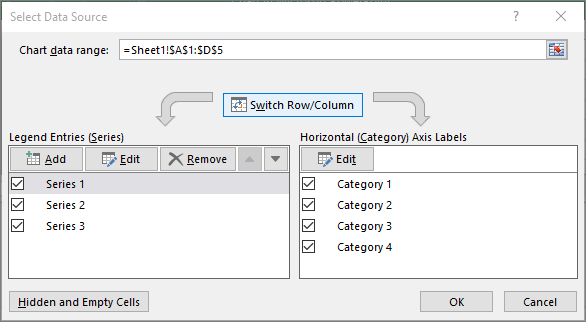
The Select Data Source dialog box appears on the worksheet that contains the source data for the chart.

-
Leaving the dialog box open, click in the worksheet, and then click and drag to select all the data you want to use for the chart, including the new data series.
The new data series appears under Legend Entries (Series) in the Select Data Source dialog box.
-
Click OK to close the dialog box and to return to the chart sheet.
Notes: If you just want to show or hide the individual data series that are displayed in your chart (without changing the data), see:
See Also
After creating a chart, you might add another data series to your worksheet that you want to include in the chart. If your chart is on the same worksheet as the data you used to create the chart (also known as the source data), you can quickly drag around any new data on the worksheet to add it to the chart.
-
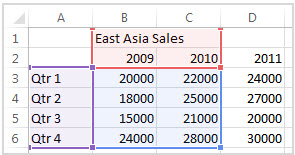
On the worksheet, in the cells directly next to or below the source data of the chart, enter the new data series you want to add.
-
Click anywhere in the chart.
The source data is selected on the worksheet showing the sizing handles.

-
On the worksheet, drag the sizing handles to include the new data.
The chart is updated automatically and shows the new data series you added.
If your chart is on a separate chart sheet, dragging might not be the best way to add a new data series. In that case, you can enter the new data for the chart in the Select Data dialog box.
Add a data series to a chart on a chart sheet
-
On the worksheet, in the cells directly next to or below the source data of the chart, type the new data and labels you want to add.
-
Click the chart sheet (a separate sheet that only contains the chart you want to update).
-
On the Chart Design tab, click Select Data.

The Select Data Source dialog box appears on the worksheet that has the source data of the chart.
-
Leaving the dialog box open, click in the worksheet, and then select all data you want to use for the chart, including the new data series.
The new data series appears under Legend Entries (Series).
-
Click OK to close the dialog box and to return to the chart sheet.
No comments:
Post a Comment