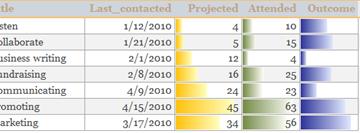
When you need to tell the story of your data at a glance, use data bars in Access. You can apply data bars to numeric fields to visually contrast data among records. For example, in the following report, you can quickly see how marketing for some training courses were more effective by the length of the data bars in the Outcome field. The data in the Outcome field displays a comparison of the projected course registration data with the attendance data after the marketing efforts.
In this article
Overview
You can apply data bars to controls in forms or reports when the control is bound to a field that is of the numeric data type. The usefulness of data bars in Access is much like the data bars in Microsoft Excel charts that make it visually easier to compare values. The length of a data bar represents the value in the cell. A longer bar represents a higher value, and a shorter bar represents a lower value. In forms, data bars are most useful in datasheet view or continuous form view.
Applying data bars is easy with the Conditional Formatting Rules Manager. You can customize data bars that specify conditions for the format and preview the effects before you apply them. For example, you can customize the bar values to represent the highest or lowest values, a number, or percent range.
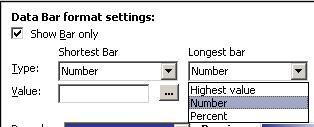
The following table explains the settings for the lower visual limit or the Shortest Bar options:
Option | Result |
|---|---|
| Lowest Value | The default setting. Sets the visual limit for the lowest value. |
| Number | Sets the lower bound of the linear scale. All values that are less than or equal to the shortest bar number are length 0. |
| Percent | Displays like the number setting but limits are placed on a lower bound's percentage for each value as compared with the rest of the records in the record set. |
The following table explains the settings for the highest visual limit or the Longest Bar options:
Option | Result |
|---|---|
| Highest Value | The default setting. Sets the visual limit for the highest value. |
| Number | Sets the upper bound of the linear scale for the gradient. All items greater than or equal to longest bar number completely fill the control. |
| Percent | Looks much like the number setting except the limits are placed on the upper bound's percentage for each value as compared with the rest of the records in the record set. |
Apply data bars to a report
When you want to show a snapshot of trends or data comparison for a large amount of data, such as top selling and bottom selling toys in a holiday sales report formatting your report with data bars can be a good option. For example in a sales report, it would be easier to understand the sales trend for a specific region when you use data bars.
To apply data bars to your report, complete the following steps:
-
Right-click the report in the Navigation Pane and then click Layout view.
-
Select the control to which you want to apply the data bars.
-
On the Format tab, in the Conditional Formatting group, click Conditional Formatting.
-
In the Conditional Formatting Rules Manager dialog box click New Rule.
-
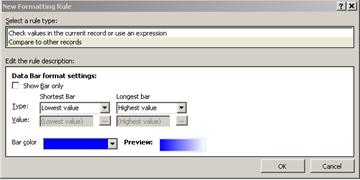
In the New Formatting Rule dialog box, under Select a rule type, select Compare to other records.
-
Under Edit the rule description, specify the rule that will determine when and what data bar format should be applied.
-
To display the data bars without the numeric values of the field, select the Show Bar only option.
The following illustrations show instances of displaying only the data bars and data bars with the corresponding values.
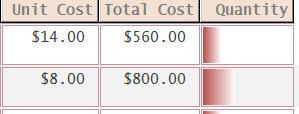
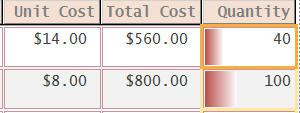
Note: The data bars for a value temporarily disappears when that control goes into edit mode.
-
Select options for Shortest Bar and Longest Bar options, and then click the Bar color arrow to select a standard or custom bar color.
Note: Preview displays a gradient view of the bar color.
-
Click OK twice to close the dialog boxes.
-
To change the font for the value displayed, complete the following steps:
-
Select the cell and press Alt + Enter if the property sheet is not already open.
-
Select the Format tab, click the arrow in Font Name property, and then select a font.
-
-
Switch to the Report View.
Apply data bars to a form
Applying data bars to values in a form is more useful in a continuous form, split form, or datasheet view. For example to in an Orders form, it would be easier to understand the sales trend for a specific region when you use data bars.
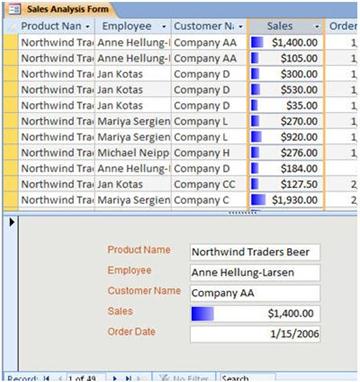
To apply data bars to a form, complete the following steps:
-
Right-click the form in the Navigation Pane and then click Layout view.
-
Select the cell where you want to apply the data bars.
-
On the Format tab, in the Conditional Formatting group, click Conditional Formatting.
-
In the Conditional Formatting Rules Manager dialog box click New Rule.
-
In the New Formatting Rule dialog box, under Select a rule type, select Compare to other records,
-
Under Edit the rule description, specify the rule that will determine when and what formatting should be applied.
Note: If you select Show bar only, the field values will not display.
-
Select a Select a Type and Value for the Shortest Bar and the Longest Bar.
-
Click the Bar color arrow to select a standard or custom bar color.
-
Click OK twice and switch to Form View.
Additional information
A tip for formatting data bars and some resources on applying other conditional formatting and displaying data visually in Access:
-
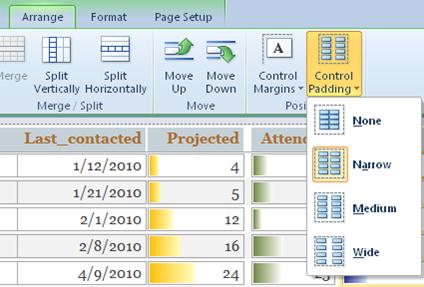
To create space between data bars : Open the form or report in Layout view, select the data bar control, and then apply required Control Padding option.
-
For more information on using conditional formatting, watch the Video: Use conditional formatting on reports.
-
Learn about the formatting options for Access reports from the article, Introduction to reports in Access.
No comments:
Post a Comment