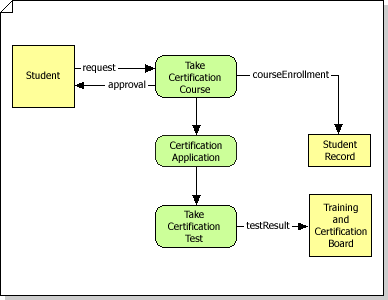
You can design data flow models using the Data Flow Model Diagram template, which includes shapes for all the symbols used in the Gane-Sarson notation.
The Data Flow Model template uses a top-down design strategy for creating data flow diagrams. You begin by creating top-level processes. Then you decompose each process into subprocesses for more detail.
Note: For information about the Gane-Sarson method, see "Structured Systems Analysis: Tools and Techniques", by C. Gane and T. Sarson (New York: IST, Inc., 1977). Also see "Conceptual Database Design", by Carlo Batini, Stefano Ceri, and Shamkant B. Navathe (Redwood City, Ca.: The Benjamin/Cummings Publishing Company, Inc., 1992).

-
Start Visio.
-
In Visio 2016 and newer versions: Click Templates > Software and Database > Data Flow Model Diagram.
In Visio 2013: Click Categories > Software and Database > Data Flow Model Diagram.
In TE000130250: Under Template Categories, click Software and Database and then click Data Flow Model Diagram.
In TE000130254: On the File menu, point to New, point to Software and Database, and then click Data Flow Model Diagram.
-
Create the top-level detail page for the diagram by dragging Interface and Process shapes from Gane-Sarson onto the drawing page.
Note: In this template, you must use a top-down design strategy for your data flow model diagram. Start the model at the top level and drill down to lower levels.
-
Connect Interface, Process, and Data Store shapes to each other using Data Flow connectors.
-
Add a detail page for each process. Your detail pages can include subprocesses that require additional detail pages.
-
Continue adding detail pages for each process (including interface, process, and data store shapes as needed, connected by data flows) until you have described the entire data flow model system in sufficient detail.
No comments:
Post a Comment