Insert subtotals in a list of data in a worksheet
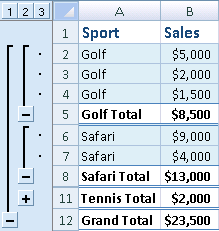
You can automatically calculate subtotals and grand totals in a list for a column by using the Subtotal command.
Important: Subototals are not supported in Excel tables. The Subtotal command will appear grayed out if you are working with an Excel table. To add subtotals in a table, you must first convert the table to a normal range of data, and then add the subtotal. Note that this will remove all table functionality from the data except table formatting. Or you can create a PivotTable.
When you insert subtotals:
-
Subtotals are calculated with a summary function, such as Sum or Average, by using the SUBTOTAL function. You can display more than one type of summary function for each column.
-
Grand totals are derived from detail data, not from the values in the subtotals. For example, if you use the Average summary function, the grand total row displays an average of all of the detail rows in the list, not an average of the values in the subtotal rows.

If the workbook is set to automatically calculate formulas, the Subtotal command recalculates subtotal and grand total values automatically as you edit the detail data. The Subtotal command also outlines the list so that you can display and hide the detail rows for each subtotal.
Insert subtotals
Note: If you filter data that contains subtotals, your subtotals may appear hidden. To display them again, clear all filters For more information on applying filters, see Quick start: Filter data by using an AutoFilter.
-
Make sure that each column in a range of data for which you want to calculate subtotals has a label in the first row, contains similar facts in each column, and that the range does not include any blank rows or columns.
-
Select a cell in the range.
-
Do one of the following:
Insert one level of subtotals
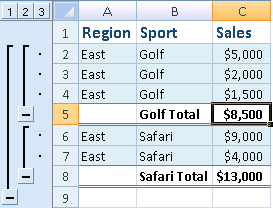
You can insert one level of subtotals for a group of data as shown in the following example.

1. At each change in the Sport column…
2. …subtotal the Sales column.
-
To sort the column that contains the data you want to group by, select that column, and then on the Data tab, in the Sort & Filter group, click Sort A to Z or Sort Z to A.
-
On the Data tab, in the Outline group, click Subtotal.

The Subtotal dialog box is displayed.
-
In the At each change in box, click the column to subtotal. For example, using the example above, you would select Sport.
-
In the Use function box, click the summary function that you want to use to calculate the subtotals. For example, using the example above, you would select Sum.
-
In the Add subtotal to box, select the check box for each column that contains values that you want to subtotal. For example, using the example above, you would select Sales.
-
If you want an automatic page break following each subtotal, select the Page break between groups check box.
-
To specify a summary row above the details row, clear the Summary below data check box. To specify a summary row below the details row, select the Summary below data check box. For example, using the example above, you would clear the check box.
-
Optionally, you can use the Subtotals command again by repeating steps one through seven to add more subtotals with different summary functions. To avoid overwriting the existing subtotals, clear the Replace current subtotals check box.
Insert nested levels of subtotals
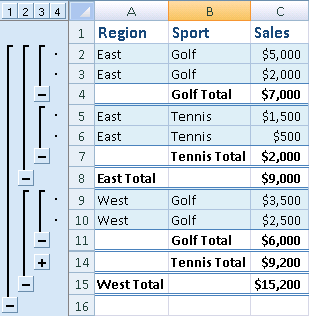
You can insert subtotals for inner, nested groups within their corresponding outer groups as shown in the following example.

1. At each change in the outer, Region column…
2. …subtotal the Sales for that region and at each change for the inner, Sport column.
-
To sort the column that contains the data you want to group by, select that column, and then on the Data tab, in the Sort & Filter group, click Sort A to Z or Sort Z to A.
-
Insert the outer subtotals.
How to insert the outer subtotals
-
On the Data tab, in the Outline group, click Subtotal.

The Subtotal dialog box is displayed.
-
In the At each change in box, click the column for the outer subtotals. For example, using the example above, you would click Region.
-
In the Use function box, click the summary function that you want to use to calculate the subtotals. For example, using the example above, you would select Sum.
-
In the Add subtotal to box, select the check box for each column that contains values that you want to subtotal. In the example above, you would select Sales.
-
If you want an automatic page break following each subtotal, select the Page break between groups check box.
-
To specify a summary row above the details row, clear the Summary below data check box. To specify a summary row below the details row, select the Summary below data check box. For example, using the example above, you would clear the check box.
-
Optionally, you can use the Subtotals command again by repeating steps one through six to add more subtotals with different summary functions. To avoid overwriting the existing subtotals, clear the Replace current subtotals check box.
-
-
Insert the nested subtotals.
How to insert the nested subtotals
-
On the Data tab, in the Outline group, click Subtotal.

The Subtotal dialog box is displayed.
-
In the At each change in box, click the nested subtotal column. For example, using the example above, you would select Sport.
-
In the Use function box, click the summary function that you want to use to calculate the subtotals. For example, using the example above, you would select Sum.
Select any other options that you want.
-
Clear the Replace current subtotals check box.
-
-
Repeat the previous step for more nested subtotals, working from the outermost subtotals in.
-
Tip: To display a summary of just the subtotals and grand totals, click the outline symbols  next to the row numbers. Use the
  and
and  symbols to display or hide the detail rows for individual subtotals.
Remove subtotals
-
Select a cell in the range that contains subtotals.
-
On the Data tab, in the Outline group, click Subtotal.

-
In the Subtotal dialog box, click Remove All.
Need more help?
You can always ask an expert in the Excel Tech Community, get support in the Answers community, or suggest a new feature or improvement on Excel User Voice.
No comments:
Post a Comment