What's new in Microsoft Office Visio 2007
Microsoft Office Visio 2007 helps you to create professional-looking diagrams for understanding, documenting, and analyzing information, data, systems, and processes.
Most graphics software programs depend on artistic skills. When you use Visio, however, conveying important information visually is as easy as opening a template, dragging shapes into your drawing, and applying themes for a finishing touch. And now, the new features and enhancements in Office Visio 2007 make creating Visio diagrams even easier and faster, for results that are more impressive than ever.
Visio is available in two editions: Microsoft Office Visio Professional 2007 and Microsoft Office Visio Standard 2007. Office Visio Standard 2007 has many of the same features that Office Visio Professional 2007 has, but Office Visio Professional 2007 includes templates for more types of diagrams, along with several advanced features.
Note: Working from existing data, you can generate many kinds of Visio Standard diagrams, including organization charts, timelines, calendars, and Gantt charts. However, the new and enhanced data features discussed in this article are included only with Office Visio Professional 2007, and not with Office Visio Standard 2007.
What do you want to do?
-
Integrate data into diagrams (requires Office Visio Professional 2007)
-
Show off your data in data graphics (requires Office Visio Professional 2007)
-
Visualize complex information by using PivotDiagrams (requires Office Visio Professional 2007)
-
Generate and view Visio diagrams in other 2007 Microsoft Office system programs
Get started quickly
You can find just the right template by using the new Getting Started window in Office Visio 2007.
Simpler template categories It is now easier to find just the right template because of simpler template categories, such as Business, Flowchart, Network, Schedule, and so on.
Large template previews Large thumbnail previews and descriptions of each template help you to quickly identify the templates that are best for your diagrams.
Featured templates The most popular Visio templates within each category are now displayed at the top of each category view, so that you can quickly find them.
Recent templates list Visio now includes a new shortcut for opening your most-recently used templates, so that you can get to your favorites more quickly.
Sample diagrams (requires Office Visio Professional 2007) You can now browse new sample diagrams and data sources to get ideas for creating your own data-driven diagrams.
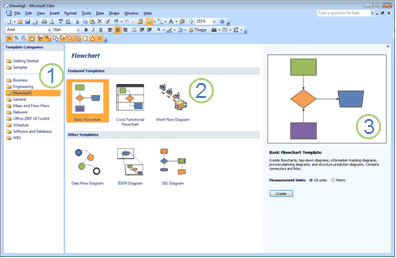
1. Template categories
2. Featured templates
3. Template preview
Create professional-looking diagrams easily
The new Themes feature in Office Visio 2007 takes the guesswork out of choosing colors and effects. Now you can give your diagram the professional touch with one click of the mouse.
Theme Colors Choose from a set of professionally designed, built-in theme colors, or create your own color scheme to match your company logo and branding. The theme colors that come with Visio match the theme colors in other 2007 Microsoft Office system programs, such as PowerPoint and Word.
Theme Effects Make your drawings more visually consistent and appealing by applying a unified set of design elements for fonts, fills, shadows, lines, and connectors.
For more information on themes, see Apply a professional look to your drawings with themes.
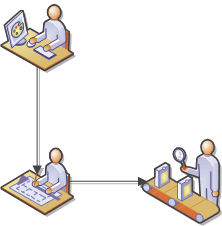
New templates and shapes Quickly create a broader range of diagrams by using new templates, such as the PivotDiagram, Value Stream Map, and ITIL (Information Technology Infrastructure Library) templates. (All of these require Office Visio Professional 2007.) You can also create more dynamic workflows by using the new Work Flow shapes in the Work Flow Diagram template. The Work Flow shapes have a new isometric 3-D style to make your diagrams look better than ever.
Connect shapes in diagrams by using AutoConnect
The new AutoConnect feature in Office Visio 2007 takes the work out of connecting shapes. This new feature automatically connects, evenly distributes, and accurately aligns shapes for you, and requires only a couple of clicks.
Connect shapes as you drag them onto the drawing page When you rest the pointer over a shape on the drawing page, you will notice that blue arrows appear around the shape. When you drag another shape onto one of the blue connection arrows, Visio automatically connects the two shapes, distributes them evenly, and aligns them for you.
Connect shapes after you click a shape on a stencil There is also now an even faster way to connect shapes. Select a shape in the Shapes window, rest the pointer over a shape on the drawing page, and then click the blue connection arrow on the side of the shape that you want to connect to. Visio automatically adds and connects the shape, distributes it evenly, and aligns it for you. In this way, you can quickly connect a whole series of shapes, such as those in a flowchart.
Connect shapes that are already on the drawing page You can even automatically connect two shapes that are both already on the drawing page. Simply click the blue connection arrow on one shape that is closest to the other shape that you want to connect it to.


For more information, see Add connectors between shapes in Visio.
Integrate data into diagrams (requires Office Visio Professional 2007)
Office Visio 2007 now takes data connectivity even further by making it much easier and faster to connect a data source to any diagram — flowchart, organization chart, network diagram, space plan, and so on — that is created by using any version of Visio. You can automatically connect diagrams to a wide range of external data sources. A new Data menu and Data toolbar keep everything that you need within reach.
Easily connect diagrams to commonly used data sources Integrate data into your diagrams by letting the new Data Selector Wizard guide you through the task of connecting to Microsoft Office Excel, Microsoft Office Access, Microsoft SQL Server™, and other commonly used external data sources. You can select custom data ranges, filter the data that you want to import, and even link diagrams to more than one data source.
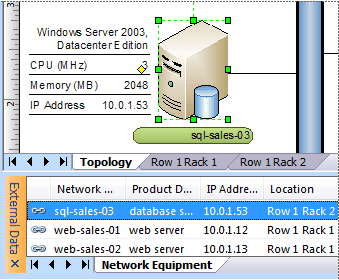
View data from within Visio After you have connected your data to your diagram, you can view the data by using the new External Data window.
Build your diagram by dragging rows of data onto a blank drawing page Select a shape in the Shapes window, and then drag a row of data from the new External Data window onto the drawing page. Visio simultaneously adds the shape to the page and associates the data with the shape.
Link data to individual shapes in existing diagrams Drag a row of data from the new External Data window onto a shape in your diagram to manually link the data to the shape. After you link data to a shape, you can see the data in the newly renamed Shape Data window (formerly called the Custom Properties window).
Automatically link data to shapes Save time by using the new Automatic Link Wizard to link the shapes in a Visio diagram to rows of data in an external data source.
Easily refresh all of the data in your diagram Use the new Refresh Data feature to automatically refresh the data in your diagram — no manual reentry required. Easily deal with any conflicts in the new Refresh Conflicts task pane. You can even schedule the refresh so that it happens automatically as often as you want it to.
Show off your data in data graphics (requires Office Visio Professional 2007)
Integrating data into diagrams is only the first step in transforming your diagrams into powerful tracking tools. Now, with Office Visio 2007, you can more easily display and customize the look of data in your diagrams to help get your message across.
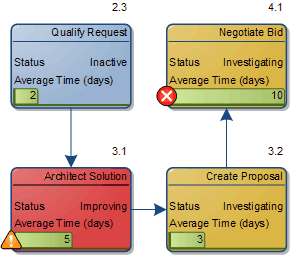
In the new Data Graphics task pane, just click the format that presents the data the way that you want it in your diagram. You can use progress bars for variable data, arrows for data that increases or decreases, and stars for ranked data. You don't need to format any of this yourself — Visio handles the formatting for you.
Also, data values can now control the color and appearance of a shape. You don't need to format them yourself, either. You need only specify the conditions under which the formatting appears.
Visualize complex information by using PivotDiagrams (requires Office Visio Professional 2007)
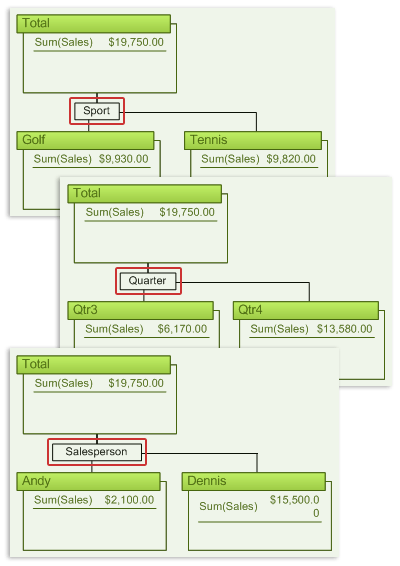
Office Visio 2007 provides a new type of diagram — the PivotDiagram. PivotDiagrams show data as a collection of shapes arranged in a tree-like structure that helps you to analyze and summarize data in a visual, easy-to-understand format. Using PivotDiagrams, you can visually explore your business data, analyze it, drill down into it, and create multiple views of it to gain deeper insight into the information. Easily identify key issues, track trends, and flag exceptions by using a library of shapes that are designed specifically for tracking data. You can even insert a PivotDiagram into any other Visio diagram to provide a complementary view of the data.
To create a PivotDiagram, you open the PivotDiagram template, and the Data Selector wizard starts immediately. The wizard guides you through each step of connecting the diagram to a data source, and then creates what is called a pivot node that is linked to all of the data in the data source. You can expand the pivot node to show various levels that correspond to the data that you want to analyze.
Generate and view Visio diagrams in other 2007 Microsoft Office system programs
Collaborate with colleagues in new ways by generating visual reports — in PivotDiagram form — right from a Windows SharePoint Services site and Microsoft Office Project 2007. Share your diagrams with people who don't have Visio, and let them preview your diagrams in Microsoft Office Outlook 2007.
Generate Visio PivotDiagrams within Microsoft Office Project In Project, you can now report on resource and task data. (Requires Microsoft Office Project 2007)
Generate Visio PivotDiagrams from SharePoint lists From SharePoint lists, you can now report on issues and tasks and track workflow. (Requires a SharePoint site)
View Visio diagrams attached to e-mail messages In Outlook, you can now preview Visio diagrams attached to e-mail even if you don't have Visio installed. (Requires Microsoft Office Outlook 2007)
Reach a wider audience
With Office Visio 2007, you can now communicate more effectively and reach a wider audience with your diagrams.
Save Visio diagrams in PDF and XPS file formats Easily share your Visio diagrams with everyone, including people who don't have Microsoft Office, by saving your diagrams in the following formats:
-
Portable Document Format (PDF) PDF is a fixed-layout electronic file format that preserves document formatting and enables file sharing. The PDF format ensures that when the file is viewed online or printed, it retains exactly the format that you intended, and that data in the file cannot be easily copied or changed. The PDF format is also useful for documents that will be reproduced by using commercial printing methods.
-
XML Paper Specification (XPS) XPS is an electronic file format that preserves document formatting and enables file sharing. The XPS format ensures that when the file is viewed online or printed, it retains exactly the format that you intended, and that data in the file cannot be easily copied or changed.
Note: You can save as a PDF or XPS file from a 2007 Microsoft Office system program only after you install an add-in. For more information, see Enable support for other file formats, such as PDF and XPS.
Prevent people from viewing sensitive information in your Visio diagrams Remove comments, reviewer markups, and other types of personal information. For more information, see Remove personal or hidden information.
Minimize the size of Visio drawing files Remove information that you don't need anymore, such as drawing previews, unused master shapes, and unused themes. For more information, see Reduce the size of a Visio file.
Diagnose computer problems
Microsoft Office Diagnostics is a series of diagnostic tests that can help you to discover why your computer is crashing. The diagnostic tests can solve some problems directly and may identify ways that you can solve other problems. Microsoft Office Diagnostics replaces the following Microsoft Office 2003 features: Detect and Repair and Microsoft Office Application Recovery.
For more information, see Diagnose and repair crashing Office programs by using Office Diagnostics.
Check your work
The following are some new features of the spelling checker:
-
The spelling checker has been made more consistent across the 2007 Microsoft Office system programs. Examples of this change include:
-
Several spelling checker options are now global. If you change one of these options in one Office program, that option is also changed for all the other Office programs.
-
In addition to sharing the same custom dictionaries, all programs can manage them using the same dialog box. For more information, see Use custom dictionaries to add words to the spelling checker.
-
-
An exclusion dictionary is automatically created for a language the first time that language is used. Exclusion dictionaries let you force the spelling checker flag words you want to avoid using. They are handy for avoiding words that are obscene or that don't match your style guide. For more information, see Use exclusion dictionaries to specify a preferred spelling for a word.
Don't have the 2007 Office release yet? You can try it or buy it now.


Really well information. Thanks a lot. Here, I got the special deals for Microsoft Visio Professional 2016 and many more .Our specialty is quick email delivery. You will get 24/7 support. So let’s check it out.
ReplyDeletehttps://freekeypro.com/microsoft-visio-professional-crack/
ReplyDeleteThank you for sharing. This is a Very Useful post. Your Writing skills are Good & Keep it up. Good Luck!
ReplyDeleteAnvsoft SynciOS Data Recovery Crack
CCleaner Professional Key Crack
Malwarebytes Anti-Exploit Premium Crack
HDRsoft Photomatix Pro Crack
ControlMyNikon Pro Crack
Webroot SecureAnywhere Antivirus Crack
M4VGear DRM Media Converter Crack
Adobe Character Animator CC Crack
I like your all post. You have done really good work. Thank you for the information you provide, it helped me a lot.
ReplyDeleteAnvsoft SynciOS Data Recovery Crack
HandBrake CS2 Crack
MacKeeper Crack
NCH Express Zip Crack
TeamViewer Crack
HandBrake CS2 Crack
WavePad Sound Editor Crack
Adobe Lightroom Crack
Microsoft Office Tutorials: What'S New In Microsoft Office Visio 2007 >>>>> Download Now
ReplyDelete>>>>> Download Full
Microsoft Office Tutorials: What'S New In Microsoft Office Visio 2007 >>>>> Download LINK
>>>>> Download Now
Microsoft Office Tutorials: What'S New In Microsoft Office Visio 2007 >>>>> Download Full
>>>>> Download LINK Es
Great work you done.
ReplyDeleteMicrosoft Visio Pro Crack