Friday, June 30, 2017

Popular options

Popular options

Top options for working with Excel

Show Mini Toolbar on selection     Shows the Mini toolbar when you select text. The Mini toolbar provides quick access to formatting tools.

Enable Live Preview     Select to preview the effects of selected options in the worksheet.

Show Developer tab in the Ribbon     Selected by default, shows the Developer tab on the Ribbon, which is a component of the Microsoft Office Fluent user interface. The Developer tab includes macro and form authoring tools, as well as XML-related features. Clear this check box to hide the Developer tab.

Always use ClearType     Selected by default, this option turns on ClearType to make the text easier to read. If you change this setting, you must restart all Microsoft Office programs for the setting to take effect.

Notes: 

  • This setting applies to all Office programs.

  • On computers running Microsoft Windows XP, turning this option on overrides the ClearType setting in Windows. This option is not available on computers running Windows Vista.

Color scheme    Allows you to change the color scheme of the program. Select the color scheme that you want in the Color Scheme box.

ScreenTip style     Select an option in the box to choose whether and how to display ScreenTips. Select Show feature descriptions in ScreenTips to display button names and helpful information, Don't show feature descriptions in ScreenTips to display button names only, and Don't show ScreenTips to hide ScreenTips.

Create lists for use in sorts and fill sequences     Click Edit Custom Lists to add lists that you can use to sort data easily and to fill data into cells in the worksheet.

When creating new workbooks

Use this font     Select the font that you want to use as the default font for new worksheets and workbooks. This font is applied when you restart Excel and create a new worksheet or workbook.

Font size     Sets the size of the default font.

Default View for new sheets     Select the view that you want Excel to display by default when you start Excel. You can select Normal View, Page Break Preview, or Page Layout View.

Include this many sheets     Sets the number of worksheets that you want to use when you create a new workbook.

Personalize your copy of Office

User name     Type a name in the Name box to change your user name.

Choose the languages you want to use with Office     Click Language Settings to set your editing language preferences for the 2007 Microsoft Office system.

Start Slack (task field)

Start Slack (task field)

Data Type    Duration

Entry Type    Calculated

Description    The Start Slack field contains the duration between the Early Start and Late Start dates. The smaller of the start slack and finish slack amounts determines the amount of free slack available, that is, the amount of time a task can be delayed without affecting the start date of a successor task or the project finish date.

How Calculated    Start slack is the duration that represents the difference between the early start and late start dates. The early start is the earliest date that a task could possibly start. Likewise, the Late Start field contains the latest date that a task can start without delaying the finish of the project. Microsoft Office Project calculates the start slack as follows:

Start Slack = Late Start - Early Start

Best Uses    Add the Start Slack and Finish Slack fields to any task view when you want to review how free slack was calculated.

Example    You are reviewing free slack in your schedule and want to see more details about how it was calculated. You add the Start Slack and Finish Slack fields to the task sheet and analyze the durations.

Remarks    If a task has an actual start date and a deadline, the start slack is 0 and the finish slack is the difference between the task's finish date and deadline date.

Set options for downloading Internet pictures

Set options for downloading Internet pictures

By default, Outlook doesn't automatically download pictures in e-mail messages if the pictures are stored on the Internet. This practice helps to protect your privacy because downloading an Internet picture can alert the sender that your e-mail address is active and that you received the message. However, you can turn off this preference or choose to download Internet pictures only from your saved contacts.

Note: This procedure doesn't affect attached pictures or pictures that are embedded in the body of a message.

  1. On the Outlook menu, click Preferences.

  2. Under E-mail, click Reading.

  3. Under Security, select the option to specify when you want to automatically download pictures from the Internet.

See also

About security in Outlook

Customize junk e-mail protection

Block or unblock a sender

About Clip Organizer collections

About Clip Organizer collections

Microsoft Clip Organizer classifies your media clips into four types of collections: My Collections and Office Collections, which always appear in the collection list, and two other collections that appear only under certain circumstances.

My Collections

When you create your own collections, they are placed in My Collections by default. For example, you might instruct Clip Organizer to scan your hard disk for existing photographs. If Clip Organizer finds photos in folders on your hard disk, it will create new collections with names that match the existing folders on your drive. If clips are found in the root directory of the drive and thus have no folder associated with them, then Clip Organizer will add these clips to the Unclassified Clips folder. You can then move this content into a more appropriately named folder.

When you download clips from the Microsoft Office Online Clip Art and Media Web site, the clips are stored in the Downloaded Clips folder created specifically for clips from this Web site.

You can use the Favorites collection to store and easily find your favorite media files.

Office Collections

Office Collections includes all media files that come with Microsoft Office.

Shared Collections

This collection holds clips shared by multiple users — for example, corporate clips that are common to your organization. Clips in this collection typically exist on a file server or common workstation. These types of collections only exist if your network administrator has created and exported a collection for use on a shared network device.

Web Collections

Inside the Web Collections folder, you'll find the Microsoft Office Online collection. By browsing this collection, or including it in your search, you can find any of the thousands of clips available on Bing. For more info, see Find pictures or clip art online.

Note: You must have an active Internet connection to view the clips on the Microsoft Office Online Web site.

Rename a table or field in a PivotTable or PivotChart Fields list

Rename a table or field in a PivotTable or PivotChart Fields list

Renaming a table or field in a PivotTable Fields or PivotChart Fields list is handled by renaming the object at its source. If you're using a Data Model as the basis for your report, the same principle applies: you rename the table or column in the Data Model and the change is picked up automatically by reports throughout the workbook.

  1. Make sure Power Pivot is enabled. See Start Power Pivot in Excel add-in for details.

  2. In the Power Pivot window, right-click the tab that contains the table that you want to rename, and then click Rename. For columns, double-click the header of the column that you want to rename, or right-click the header and select Rename Column from the context menu.

    Note:  If Power Pivot is unresponsive, switch back to Excel to see if an error message is open. Close any error messages, and then go back to Power Pivot to finish updating any calculations using the renamed object.

  3. Update calculations in the Data Model to use the new name:

    • Look for error icons in the tabs at the bottom of the workspace. Calculations that need updating will be flagged accordingly.

    • Edit the calculation to use the new names.

    • If Automatic Calculation Mode is turned on, the calculation will update immediately. Otherwise, right-click the column and select Calculate Now. See Recalculate Formulas for details.

      Notes: 

      • The best time to rename tables is during the import process, or before you start to build complex relationships and calculations.

      • When using Power Pivot to import data, you can change the name of a table during the import process by typing a Friendly Name in the Select Tables and Views page of the Table Import Wizard.

      • You can also change table and column names if you import data by specifying a query on the Specify a SQL Query page of the Table Import Wizard.

Top of Page

EXPONDIST function

EXPONDIST function

Returns the exponential distribution. Use EXPONDIST to model the time between events, such as how long an automated bank teller takes to deliver cash. For example, you can use EXPONDIST to determine the probability that the process takes at most 1 minute.

Syntax

EXPONDIST(x,lambda,cumulative)

X     is the value of the function.

Lambda     is the parameter value.

Cumulative     is a logical value that indicates which form of the exponential function to provide. If cumulative is TRUE, EXPONDIST returns the cumulative distribution function; if FALSE, it returns the probability density function.

Remarks

  • If x or lambda is nonnumeric, EXPONDIST returns the #VALUE! error value.

  • If x < 0, EXPONDIST returns the #NUM! error value.

  • If lambda ≤ 0, EXPONDIST returns the #NUM! error value.

  • The equation for the probability density function is:

    Equation

  • The equation for the cumulative distribution function is:

    Equation

Example 1

Formula

Description (Result)

=EXPONDIST(0.2,10,FALSE)

Probability exponential distribution function (1.353353)

Example 2

X

Lambda

Formula

Description (Result)

0.2

10

=EXPONDIST([X],[Lambda],TRUE)

Cumulative exponential distribution function (0.864665)

How to correct a #VALUE! error in AVERAGE or SUM functions

How to correct a #VALUE! error in AVERAGE or SUM functions

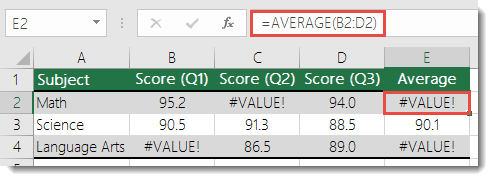
If AVERAGE or SUM refer to cells that contain #VALUE! errors, the formulas will result in a #VALUE! error.

#VALUE! error in AVERAGE

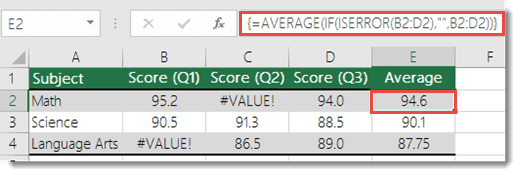
In order to overlook the error values, we'll construct a formula that ignores the errors in the reference range while calculating the average with the remaining "normal" values.

To work around this scenario, we use a combination of AVERAGE along with IF and ISERROR to determine if there is an error in the specified range. This particular scenario requires an array formula:

=AVERAGE(IF(ISERROR(B2:D2),"",B2:D2))

Note: This is an Array formula and needs to be entered with CTRL+SHIFT+ENTER. Excel will automatically wrap the formula in braces {}. If you try to enter them yourself Excel will display the formula as text.

Array function in AVERAGE to resolve the #VALUE! error

Note: The above function will not only work for #VALUE!, but also for #N/A, #NULL, #DIV/0!, and others.

You could also use SUM in the same fashion:

=SUM(IF(ISERROR(B2:D2),"",B2:D2))

Do you have a specific function question?

Post a question in the Excel community forum

Help us improve Excel

Do you have suggestions about how we can improve the next version of Excel? If so, please check out the topics at Excel User Voice.

See Also

Correct a #VALUE! error

AVERAGE function

SUM function

Overview of formulas in Excel

How to avoid broken formulas

Use error checking to detect errors in formulas

All Excel functions (alphabetical)

All Excel functions (by category)

Create a calendar for a task within Project

Create a calendar for a task within Project

Tasks can have their own calendars. By default, tasks are scheduled based upon the project calendar. To define unique or specific exceptions, such as for machinery that runs during nonworking time, or an office move that can occur only on a weekend, you can create a task calendar for individual tasks. A task calendar that is associated with a task overrides the project calendar.

  1. Click the Project tab, and in the Properties group, click Change Working Time.

  2. Click Create New Calendar.

  3. In the Create New Base Calendar dialog box, type of name for the new calendar and then choose whether you want to create a new base calendar or make a calendar that is based on a copy of an existing calendar.

  4. Click OK to return to the Change Working Time dialog box.

  5. To change the work week for the task calendar, click the Work Weeks tab.

  6. Click the row in the table that indicates the default schedule for the task calendar, and then click Details.

  7. In the Details for dialog box, select the days of the week that you want to change throughout the scheduling of the task, and then select one of the following:

    • Use Project default working times for these days      Choose the days that should use the default working times, which are 8:00 A.M. to 12:00 P.M. and 1:00 P.M. to 5:00 P.M., Monday through Friday, and nonworking time on weekends.

    • Set days to nonworking time      Choose the days on which no work can be scheduled. The change that you make will be reflected in all the months in the calendar.

    • Set day(s) to these specific working times      To set the working times for the selected days throughout the schedule, type the times that you want work to start in the From boxes and the times you want work to end in the To boxes.

Note: 

  • After you create a base calendar, you need to assign that calendar to a task. Select the task, right-click the task, and then click Information, click the Advanced tab, and then select the calendar from the Calendar list.

  • To delete a calendar, use the Organizer. Click the File tab. Click Info, and then click Global Organizer. Click the Calendars tab. On the right, select the task calendar you want to delete, and then click Delete.

Top of Page

Mark an email message as not junk

Mark an email message as not junk

Depending on the Junk Email Filter protection level that is set, some legitimate email messages might be moved to the Junk E-mail folder. For this reason, we recommend that you periodically review messages moved to the Junk E-mail folder to make sure that you aren't missing any legitimate messages.

To mark a message as not junk, do the following:

  1. In Mail, click the Junk E-mail folder in the Navigation Pane.

    Junk E-mail folder selected in the Navigation Pane

    Tip:  To avoid seeing objectionable content in the Junk E-mail folder, you can turn off the Reading Pane. Reading Pane settings are unique to each folder.

  2. In the message list, click any message that you want to mark as not junk.

  3. On the Home tab, in the Delete group, click Not Junk.

Keyboard shortcut    To mark a message as not junk, select the message, and then press CTRL+ALT+J.

Notes: 

  • A message that is marked as not junk is moved back to its original folder, usually the Inbox. If you have more than one email account, the message is moved to the Inbox (or appropriate other folder) in the active email account.

  • When you mark a message as not junk, you can add the sender or the mailing list name to the Safe Senders List or Safe Recipients List.

  • By default, the Junk Email Filter is arranged by conversation. You can click the conversation header and mark the whole conversation as not junk if the conversation isn't expanded. You can mark individual messages in an expanded conversation.

  • Any message viewed in the Junk E-mail folder appears in plain text format and any links that it contains are disabled. When a message is moved out of the Junk E-mail folder, its original message format is restored, and any links are enabled. However, links remain disabled if the message is also categorized as suspicious.

Top of Page

Show or hide gridlines on a worksheet

Show or hide gridlines on a worksheet

Learn more about cell gridlines, and how to show or hide them in Microsoft Excel workbooks.

In this article

What are cell gridlines?

Hide gridlines on a worksheet

Show gridlines on a worksheet

What are cell gridlines?

Gridlines are the faint lines that appear around cells to distinguish them on the worksheet.

Worksheet in which gridlines are showing

When working with gridlines, consider the following:

  • By default, gridlines are displayed in worksheets using a color that is assigned by Excel. If you want, you can change the color of the gridlines for a particular worksheet by clicking Gridline color under Display options for this worksheet (File tab, Options, Advanced category).

  • People often confuse borders and gridlines in Excel. Gridlines cannot be customized in the same manner that borders can. If you want to change the width or other attributes of the lines for a border, see Apply or remove cell borders on a worksheet.

  • If you apply a fill color to cells on your worksheet, you won't be able to see or print the cell gridlines for those cells. To see or print the gridlines for these cells, remove the fill color by selecting the cells, and then click the arrow next to Fill Color Button image (Home tab, Font group), and To remove the fill color, click No Fill.

    Note:  You must remove the fill completely. If you change the fill color to white, the gridlines will remain hidden. To keep the fill color and still see lines that serve to separate cells, you can use borders instead of gridlines. For more information, see Apply or remove cell borders on a worksheet.

  • Gridlines are always applied to the whole worksheet or workbook, and can't be applied to specific cells or ranges. If you want to apply lines selectively around specific cells or ranges of cells, you should use borders instead of, or in addition to, gridlines. For more information, see Apply or remove cell borders on a worksheet.

Top of Page

Hide gridlines on a worksheet

If the design of your workbook requires it, you can hide the gridlines:

Worksheet in which gridlines have been hidden

  1. Select one or more worksheets.

    How to select worksheets

    To select

    Do this

    A single sheet

    Click the sheet tab.

    Active sheet tab

    If you don't see the tab that you want, click the tab scrolling buttons to display the tab, and then click the tab.

    Tab scrolling buttons

    Two or more adjacent sheets

    Click the tab for the first sheet. Then hold down Shift while you click the tab for the last sheet that you want to select.

    Two or more nonadjacent sheets

    Click the tab for the first sheet. Then hold down Ctrl while you click the tabs of the other sheets that you want to select.

    All sheets in a workbook

    Right-click a sheet tab, and then click Select All Sheets on the shortcut menu.

    Tip: When multiple worksheets are selected, [Group] appears in the title bar at the top of the worksheet. To cancel a selection of multiple worksheets in a workbook, click any unselected worksheet. If no unselected sheet is visible, right-click the tab of a selected sheet, and then click Ungroup Sheets.

  2. In Excel 2007: On the View tab, in the Show/Hide group, clear the Gridlines check box.

    Gridlines check box in Show/Hide group

    In all other Excel versions: On the View tab, in the Show group, clear the Gridlines check box.

    Options in the Show group on the View tab

Top of Page

Show gridlines on a worksheet

If the gridlines on your worksheet are hidden, you can follow these steps to show them again.

  1. Select one or more worksheets.

    How to select worksheets

    To select

    Do this

    A single sheet

    Click the sheet tab.

    Active sheet tab

    If you don't see the tab that you want, click the tab scrolling buttons to display the tab, and then click the tab.

    Tab scrolling buttons

    Two or more adjacent sheets

    Click the tab for the first sheet. Then hold down Shift while you click the tab for the last sheet that you want to select.

    Two or more nonadjacent sheets

    Click the tab for the first sheet. Then hold down Ctrl while you click the tabs of the other sheets that you want to select.

    All sheets in a workbook

    Right-click a sheet tab, and then click Select All Sheets on the shortcut menu.

    Tip: When multiple worksheets are selected, [Group] appears in the title bar at the top of the worksheet. To cancel a selection of multiple worksheets in a workbook, click any unselected worksheet. If no unselected sheet is visible, right-click the tab of a selected sheet, and then click Ungroup Sheets.

  2. Excel 2007: On the View tab, in the Show/Hide group, select the Gridlines check box.

    All other Excel versions: On the View tab, in the Show group, select the Gridlines check box.

Note:  Gridlines do not print by default. For gridlines to appear on the printed page, select the Print check box under Gridlines (Page Layout tab, Sheet Options group).

Top of Page

Link risks, issues, files, or deliverables to tasks

Link risks, issues, files, or deliverables to tasks

< More Project help

As you work on a project, you may find it useful to capture risks, track issues, upload files, and list deliverables on the project site. Sometimes, these risks, issues, files, and deliverables are tied to specific tasks within the project. By linking these items to their related tasks, you give yourself a reminder of where you need to keep an eye on things, or where you have files that you might need to refer to or keep updated.

You can link things together by starting with the risk, issue, file, or deliverable, or by starting with the task.

Starting from the risk, issue, file, or deliverable you've already added

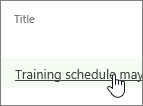
  1. Click the name of the issue, risk, file, or deliverable, to view it.

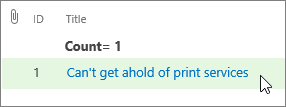
    Click the risk in the Title column
  2. Click Add Related Item.

    Add Related Item
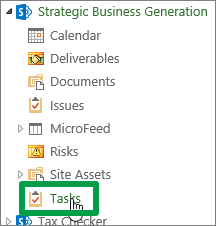
  3. On the left side of the box, under the name of your project, click Tasks.

    Click Tasks under your project name
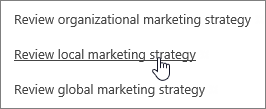
  4. On the right side of the box, click the row for the specific task (or tasks) you want to link the issue, risk, file, or deliverable to.

    Click a task row
  5. Click Insert to link the item to the task.

    Click Insert

Starting from your tasks

  1. Add your project's risks, issues, files, or deliverables to the project site.

  2. In Project Web App, click Projects on the Quick Launch.

    Projects on the Quick Launch

  3. Click the name of a project in the list.

    Project Center

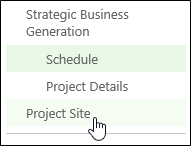
  4. Click Project Site on the Quick Launch.

    Project Site on the Quick Launch

  5. Click Tasks on the Quick Launch.

    Click Tasks on the Quick Launch

  6. Click the name of a task in the list.

    Click a task

  7. Click Show More.

    Show More

  8. Click Add Related Item.

    Add Related Item

  9. On the left side of the box, under the name of your project, click Risks, Issues, Documents, or Deliverables.

    Click an item type

  10. On the right side of the box, click the row for the specific item you want to link the task to.

    Click item

  11. Click Insert to link the issue to the task.

    Click Insert

Still stuck?

If you're still not finding the answers you need, try searching for content on support.office.com, or browsing through the list of topics on the Project Help Center.

You may also find it helpful to post your questions and issues on a discussion forum. The Project discussion forums tend to be very active, which make them a great resource for finding others who may have worked through similar issues, or encountered the same situation.

Not finding what you need? Try the forums.

Set Phones options

Set Phones options

Use the Lync – Options > Phones window to set up or change settings for any phone you use with Lync.

Add or change a phone number

Add numbers to your contact card to give people a way to reach you when you're not at your computer, or in case they prefer to use a phone. Your phone numbers show up on your contact card and are visible to your Lync contacts based on the privacy relationship they have with you.

  1. Under My phone numbers, click the box for the type of number you want to add or change, and type the number. Use only the digits 0123456789, and no parentheses or hyphens. When adding international numbers, type the + sign, then the country code followed by the local number.

  2. To make this number visible to contacts, select the Include in my contact card check box next to the number.

Your number will be visible as follows:

  • Work Phone is visible to all contacts except your External Contacts and Blocked Contacts.

    Note:  Some companies do not allow you to clear the Include in my contact card check box for your work phone.

  • Mobile Phone is visible only to your Workgroup and Friends and Family.

  • Home Phone is visible only to your Friends and Family.

  • Other Phone is visible only to your Friends and Family. Use this option to add or modify additional numbers, such as for a temporary office or an alternate cell phone.

Tip:  To see which of your contacts have each of these relationships with you, in your Contacts list, select the Relationship tab. Contacts are grouped there by privacy relationship. To change the relationship you have with a contact, right-click the contact listing, and then click Change Privacy Relationship. For more details, see Control access to your presence information in Lync.

Use a TTY device

Text telephone (TTY) mode is used for text communication over a telephone line. A TTY device must be connected to the computer to interpret the modified audio; otherwise you might experience poor audio quality during the call. Using TTY mode in a conference call may also cause audio quality issues.

TTY mode is turned off by default. To turn on the feature:

  1. Connect a TTY device to your computer.

  2. Under Phone accessibility, click Turn on TTY mode.

  3. Sign out of Lync, and then sign in again.

Set Lync Meeting options

You can use the same audio with all your Lync Meetings or set up Lync to give you options every time you join. The latter is handy if you need to use a different audio connection, depending on the meeting or location you join from.

  1. Under Joining conference calls, click the drop-down menu next to Join meeting audio from, and do one of the following:

  2. To use computer audio and video (via your computer microphone and speakers or a headset) for the meeting, select Lync.

  3. To have Lync call you, select the phone number you want to be reached at. If you don't see your number, type it under My phone numbers at the top of the window.

  4. To call into the meeting, if the meeting request includes a call-in number, select Do not join audio, join the meeting, and then use a phone to call in.

  5. (Optional) If you join from different locations or devices and want to choose how you connect to meetings each time you join, select the Before I join meetings, ask me which audio device I want to use check box.

Note:  You can have Lync call you (and set up Lync Meetings that include call-in details) only if dial-in conferencing is configured for your account. For details, contact your workplace technical support.

Top of Page

About the BI Center

About the BI Center

The following video is designed to help Microsoft Project Web App site administrators become familiar with the business intelligence and reporting environment used in Microsoft Project Server 2010. Once you're more familiar with how reporting works, you will be better prepared to roll out the BI Center in an effective way for your organization.

Your browser does not support video. Install Microsoft Silverlight, Adobe Flash Player, or Internet Explorer 9.

Top of Page

View resource workloads and availability

View resource workloads and availability

As a project manager, one of the most important aspects of your role is to monitor the assignments for each of your resources so that you can effectively balance their workloads. Some resources might be overallocated, and others might be underallocated. You can review how efficiently your resources are being used in your project, and whether you need to make any adjustments, by viewing their workloads and availability in Microsoft Project.

These instructions are specific to Microsoft Project 2016, 2013, and 2010.

What do you want to do?

Review resource workloads by using the Resource Usage view

Review availability for enterprise resources by using Project Online

Use a graph to view individual workloads

View a list of resources who are overallocated

Group resources who are overallocated

Find resources who have available time

Review resource workloads by using the Resource Usage view

  1. In the Task or Resource tab, click Resource Usage in the View dropdown menu.

  2. Review the resource names and their assigned tasks in the table portion of the Resource Usage view.

  3. Review the timescale portion of the view to see how work is allocated over the selected time period.

In many resource views, including the Resource Usage view, overallocated resources are shown in red. An overallocation occurs whenever a resource's maximum units have been exceeded for any period of time. In resource sheets, the indicator field for overallocated resources also includes the Resource leveling indicator, which indicates that the resource be leveled. Check for the indicator, and review the task assignments to assess whether the overallocation is acceptable.

For example, suppose that two tasks have a duration of four hours, and that they both start and finish at the same times. If you assign both tasks to Bob, he is technically overallocated, because during that four-hour span of the two tasks, Bob is working at 200 percent. However, if leveling is set to a day-by-day basis, Bob does not need to be leveled, because during the whole day he doesn't exceed his total eight-hour capacity to work.

Note: Along with resource assignments for tasks in the currently opened project, the Resource Usage view also displays summary resource assignments. Summary resource assignments indicate the total amount of work a resource is assigned to in all other projects. Summary resource assignments are only shown if you are connected to Microsoft Project Server and if you have an enterprise project open. If you don't want summary assignment rows to affect the totals shown in the Resource Usage view, you can select the summary assignment rows and then press DELETE.

You can also display and modify the Resource Usage view to see all of the resource assignments and their percentages of work allocation in a timesheet. This view shows all assignments by resource, and shows how fully these resources are allocated to assigned tasks over time.

  1. In the Task or Resource tab, click Resource Usage in the View dropdown menu.

  2. In the Format tab, click Add Details.

  3. In the Available fields list, click Percent Allocation, and then click Show.

  4. Review the timescale portion of the view. In the % Alloc. row that you've just added, you can see the percentage of the resource's total available working time that is allocated to assignments during the selected time period. In addition, the timescale portion of the view shows both the resource's overallocated work and its allocation percentage in red, making it possible for you to pinpoint exactly when the resource becomes overallocated.

Tip: You can zoom in on the time period shown in the timescale (for example, you can change the view from days to hours) by clicking Zoom In (+) located at the bottom right corner of the window. Likewise, you can zoom out from the time period (for example, you can change the view from days to weeks) by clicking Zoom Out (-).

Review availability for enterprise resources by using Project Online

To find overallocated or underallocated resources either within a project or across projects, you can access Project Online and view a graph and table of resource availability.

  1. From the Project Online Project Center, click Resources in the left side menu.

  2. Select the resource or resources whose availability information you want to view by selecting the check box next to their name and then in the Resources tab, click Capacity Planning in the Navigate section.

    To select adjacent resources in the list, hold down SHIFT while you click the first and then the last resource. To select nonadjacent resources, hold down CTRL while you click each resource.

  3. In the Views section of the Availability tab, select a resource view.

    • To display assignment work grouped first by resources and then by the projects that the resource appears in, select Work by Resource.

    • To display assignment work grouped by the projects that the resource appears in, select Resource Utilization by Project.

    • To display the amount of time that the resource has available to work during a specified time period, select Remaining Availability.

    • To display the amount of work that the resource is assigned to do, select Resource Utilization.

  4. If you selected multiple resources on the previous page, you can click in the legend on the chart to select the resources that you want to view in the graph.

    The Details table below the graph shows a timescale that displays how much work the resource is assigned to during the specified time period.

Tip: To see a different date range in the chart, click Set Date Ranges in the Availability tab, and then select new dates in the Set Date Range boxes.

Use a graph to view individual workloads

The Resource Graph view displays a bar chart view of an individual resource's workload and availability. This view allows you to quickly discover whether the selected resource is overallocated or underallocated for a specific period of time. You can also see the percentage of units allocated for assignments, along with the resource's maximum units availability.

  1. In the Resource tab, select the Resource Graph view in the View section.

  2. Review the name of the first resource in the Resource Graph view by scrolling left or right in the left window.

    If the resource name is listed in red, then the resource is overallocated. Resources listed in black are allocated either exactly at or under their full capacity.

  3. Review the bar chart to see the level of overallocation or underallocation.

    Blue bars (by default) indicate the amount of allocated work that is at or below the resource's maximum unit and working time availability for that time period. Red bars (by default) indicate that the resource is overallocated because the resource has exceeded their maximum unit and working time availability for a given time period.

  4. Review the highest allocation percentages that occur in the time period shown — that is, the peak units for the resource in the time period.

    Peak units are listed at the bottom of the graph.

  5. To view the bar graph for the next resource, either press PAGE DOWN or use the scroll bar or the arrow keys.

Top of Page

View a list of resources who are overallocated

You can see a list of only those resources that are overallocated by displaying the Resource Sheet view or the Resource Usage view, and then filtering for overallocated resources.

  1. In the View section, click Resource Sheet or Resource Usage from the dropdown.

  2. In the View tab, click the Filter dropdown menu in the Data section, and then click Overallocated Resources.

  3. To see the full list of resources again, click the Filter dropdown menu and then click No Filter.

Note: Even without filtering for overallocated resources, you can easily see which resources are overallocated, because their names are shown in red in any resource view. Also, in the Resource Sheet and Resource Usage views, the indicator field will suggest that overallocated resources be leveled.

Task views can also be used to display overallocations, though they don't show overallocations in red the way that resource views do. If you are working in a task view, you can step through each task that has resource overallocations, though a task view won't show you which resources (or how many) are overallocated.

While in any task view, such as the Gantt Chart or Network Diagram, in the Resource tab, click Next Overallocation in the Level section.

Group resources who are overallocated

In the Resource Sheet or Resource Usage view, you can group resources who are overallocated. You can also group resources by their peak units, which indicate their maximum percentage allocations on assignments during the project. Reviewing overallocated resources by the extent of their overallocations can help you to focus on the most extensively overallocated resources first.

  1. In the View section, click Resource Sheet or Resource Usage.

  2. In the View tab, click on the Group by dropdown menu and then click New Group By.

  3. In the Field Name box, select Overallocated.

  4. In the Order box, select Ascending or Descending.

    If you click Ascending, the group of resources that are not overallocated appears first and the group of overallocated resources appears second.

  5. To create a nested grouping of peak units, click the Then by box, and then click Peak.

  6. Supply a name for the grouping and then click Apply.

    The view is grouped according to your specifications. Any resource that has any assignment exceeding 100 percent of peak units at any time during the project is grouped under Overallocated: Yes. If you specify a nested grouping of peak units, you might have additional groupings under headings such as Peak: 200%, Peak: 300%, and so on.

  7. To see resources listed in their original order in the Group by box, click [No Group].

Find resources who have available time

If you have resources who are overallocated, you might want to identify resources in the project who have available time, so that you can distribute the workload more evenly. This capacity is also useful if there are additional unassigned tasks and you want to find out who is available to take on more work.

Resource availability is calculated using the following formula:

Resource Availability = Resource Capacity - (Summary Resource Assignment + Calendar Exceptions)

The Summary Resource Assignment is the sum of all work done by the resource, and Calendar Exceptions are any exceptions on the resource's base calendar.

To find resources who can work additional hours on a job, you can display and modify the Resource Usage view to see the amount of time (hours, days, or weeks) that a resource has available for additional assignments. You can also use this view to redistribute work from overallocated resources to underallocated ones.

  1. In the View section, click Resource Usage.

  2. In the Format tab, in the Details section, check the Remaining Availability box.

  3. In the Rem. Avail. (remaining availability) row, review the amount of work that represents remaining availability, or underallocation, for each time period.

You can also display and modify the Resource Graph view to view a bar chart of an individual resource's workload, which can help you to discover who can work additional hours on a task. You can review information about one underallocated resource at a time in the Resource Graph view. You can see the amount of available work by time period.

  1. In the View section, click Resource Graph.

  2. In the Format tab, click the Graph dropdown menu, and then select Work Availability.

  3. For the selected resource, review the amount of available work shown in the bar chart. Scroll through the timescale to see underallocations during varying periods of time.

  4. Review the amount of available time for the selected resource at the bottom of the graph.

  5. To move to the next resource that has available time, press PAGE DOWN or use the scroll bar or the arrow keys in the left pane.

Top of Page

These instructions are specific to Microsoft Project 2007.

What do you want to do?

Review resource workloads by using the Resource Usage view

Review availability for enterprise resources by using Project Online

Use a graph to view individual workloads

View a list of resources who are overallocated

Group resources who are overallocated

Find resources who have available time

Review resource workloads by using the Resource Usage view

  1. On the View menu, click Resource Usage.

  2. Review the resource names and their assigned tasks in the table portion of the Resource Usage view.

  3. Review the timescale portion of the view to see how work is allocated over the selected time period.

In many resource views, including the Resource Usage view, overallocated resources are shown in red. An overallocation occurs whenever a resource's maximum units have been exceeded for any period of time. In resource sheets, the indicator field for overallocated resources also includes the Resource leveling indicator Resource leveling indicator , which indicates that the resource be leveled. Check for the indicator, and review the task assignments to assess whether the overallocation is acceptable.

For example, suppose that two tasks have a duration of four hours, and that they both start and finish at the same times. If you assign both tasks to Bob, he is technically overallocated, because during that four-hour span of the two tasks, Bob is working at 200 percent. However, if leveling is set to a day-by-day basis, Bob does not need to be leveled, because during the whole day he doesn't exceed his total eight-hour capacity to work.

Note: Along with resource assignments for tasks in the currently opened project, the Resource Usage view also displays summary resource assignments. Summary resource assignments indicate the total amount of work a resource is assigned to in all other projects. Summary resource assignments are only shown if you are connected to Microsoft Office Project Server and if you have an enterprise project open. If you don't want summary assignment rows to affect the totals shown in the Resource Usage view, you can select the summary assignment rows and then press DELETE.

You can also display and modify the Resource Usage view to see all of the resource assignments and their percentages of work allocation in a timesheet. This view shows all assignments by resource, and shows how fully these resources are allocated to assigned tasks over time.

  1. On the View menu, click Resource Usage.

  2. On the Format menu, click Detail Styles.

  3. In the Available fields list, click Percent Allocation, and then click Show.

  4. Review the timescale portion of the view. In the % Alloc. row that you've just added, you can see the percentage of the resource's total available working time that is allocated to assignments during the selected time period. In addition, the timescale portion of the view shows both the resource's overallocated work and its allocation percentage in red, making it possible for you to pinpoint exactly when the resource becomes overallocated.

Tip: You can zoom in on the time period shown in the timescale (for example, you can change the view from days to hours) by clicking Zoom In Button image . Likewise, you can zoom out from the time period (for example, you can change the view from days to weeks) by clicking Zoom Out Button image .

Review availability for enterprise resources by using Project Online

To find overallocated or underallocated resources either within a project or across projects, you can access Project Online and view a graph and table of resource availability.

  1. From the Project Online Project Center, click Resources in the left side menu.

  2. Select the resource or resources whose availability information you want to view by selecting the check box next to their name and then in the Resources tab, click Capacity Planning in the Navigate section.

    To select adjacent resources in the list, hold down SHIFT while you click the first and then the last resource. To select nonadjacent resources, hold down CTRL while you click each resource.

  3. In the Views section of the Availability tab, select a resource view.

    • To display assignment work grouped first by resources and then by the projects that the resource appears in, select Work by Resource.

    • To display assignment work grouped by the projects that the resource appears in, select Resource Utilization by Project.

    • To display the amount of time that the resource has available to work during a specified time period, select Remaining Availability.

    • To display the amount of work that the resource is assigned to do, select Resource Utilization.

  4. If you selected multiple resources on the previous page, you can click in the legend on the chart to select the resources that you want to view in the graph.

    The Details table below the graph shows a timescale that displays how much work the resource is assigned to during the specified time period.

Tip: To see a different date range in the chart, click Set Date Ranges in the Availability tab, and then select new dates in the Set Date Range boxes.

Use a graph to view individual workloads

The Resource Graph view displays a bar chart view of an individual resource's workload and availability. This view allows you to quickly discover whether the selected resource is overallocated or underallocated for a specific period of time. You can also see the percentage of units allocated for assignments, along with the resource's maximum units availability.

  1. On the View menu, click Resource Graph.

  2. Review the name of the first resource in the Resource Graph view.

    If the resource name is listed in red, then the resource is overallocated. Resources listed in black are allocated either exactly at or under their full capacity.

  3. Review the bar chart to see the level of overallocation or underallocation.

    Blue bars (by default) indicate the amount of allocated work that is at or below the resource's maximum unit and working time availability for that time period. Red bars (by default) indicate that the resource is overallocated because the resource has exceeded their maximum unit and working time availability for a given time period.

  4. Review the highest allocation percentages that occur in the time period shown — that is, the peak units for the resource in the time period.

    Peak units are listed at the bottom of the graph.

  5. To view the bar graph for the next resource, either press PAGE DOWN or use the scroll bar or the arrow keys.

Top of Page

View a list of resources who are overallocated

You can see a list of only those resources that are overallocated by displaying the Resource Sheet view or the Resource Usage view, and then filtering for overallocated resources.

  1. On the View menu, click Resource Sheet or Resource Usage.

  2. In the view, click Filter, and then click Overallocated Resources.

  3. To see the full list of resources again, click Filter, and then click All Resources.

Note: Even without filtering for overallocated resources, you can easily see which resources are overallocated, because their names are shown in red in any resource view. Also, in the Resource Sheet and Resource Usage views, an indicator Resource leveling indicator appears in the indicator field, indicating that overallocated resources be leveled.

Task views can also be used to display overallocations, though they don't show overallocations in red the way that resource views do. If you are working in a task view, you can step through each task that has resource overallocations, though a task view won't show you which resources (or how many) are overallocated.

  1. While in any task view, such as the Gantt Chart or Network Diagram, on the View menu, point to Toolbars, and then click Resource Management.

  2. On the Resource Management toolbar, click Go To Next Overallocation Button image .

Group resources who are overallocated

In the Resource Sheet or Resource Usage view, you can group resources who are overallocated. You can also group resources by their peak units, which indicate their maximum percentage allocations on assignments during the project. Reviewing overallocated resources by the extent of their overallocations can help you to focus on the most extensively overallocated resources first.

  1. On the View menu, click Resource Sheet or Resource Usage.

  2. On the Project menu, point to Group by, and then click Customize Group By.

  3. In the Field Name box, click Overallocated.

  4. In the Order box, click Ascending or Descending.

    If you click Ascending, the group of resources that are not overallocated appears first and the group of overallocated resources appears second.

  5. To create a nested grouping of peak units, click the Then by box, and then click Peak Units.

  6. To save this grouping, click Save. Supply a name for the grouping, and if you want the grouping to show in the Group by menu, select the Show in menu check box. Click OK to close the Save Group dialog box.

    The view is grouped according to your specifications. Any resource that has any assignment exceeding 100 percent of peak units at any time during the project is grouped under Overallocated: Yes. If you specify a nested grouping of peak units, you might have additional groupings under headings such as Peak: 200%, Peak: 300%, and so on.

  7. To see resources listed in their original order in the Group by box, click No Group.

Find resources who have available time

If you have resources who are overallocated, you might want to identify resources in the project who have available time, so that you can distribute the workload more evenly. This capacity is also useful if there are additional unassigned tasks and you want to find out who is available to take on more work.

Resource availability is calculated using the following formula:

Resource Availability = Resource Capacity - (Summary Resource Assignment + Calendar Exceptions)

The Summary Resource Assignment is the sum of all work done by the resource, and Calendar Exceptions are any exceptions on the resource's base calendar.

To find resources who can work additional hours on a job, you can display and modify the Resource Usage view to see the amount of time (hours, days, or weeks) that a resource has available for additional assignments. You can also use this view to redistribute work from overallocated resources to underallocated ones.

  1. On the View menu, click Resource Usage.

  2. On the Format menu, point to Details, and then click Remaining Availability.

  3. In the Rem. Avail. (remaining availability) row, review the amount of work that represents remaining availability, or underallocation, for each time period.

You can also display and modify the Resource Graph view to view a bar chart of an individual resource's workload, which can help you to discover who can work additional hours on a task. You can review information about one underallocated resource at a time in the Resource Graph view. You can see the amount of available work by time period.

  1. On the View menu, click Resource Graph.

  2. On the Format menu, point to Details, and then click Work Availability.

  3. For the selected resource, review the amount of available work shown in the bar chart. Scroll through the timescale to see underallocations during varying periods of time.

  4. Review the amount of available time for the selected resource at the bottom of the graph.

  5. To move to the next resource that has available time, press PAGE DOWN or use the scroll bar or the arrow keys.

Top of Page